Point Clear, AL
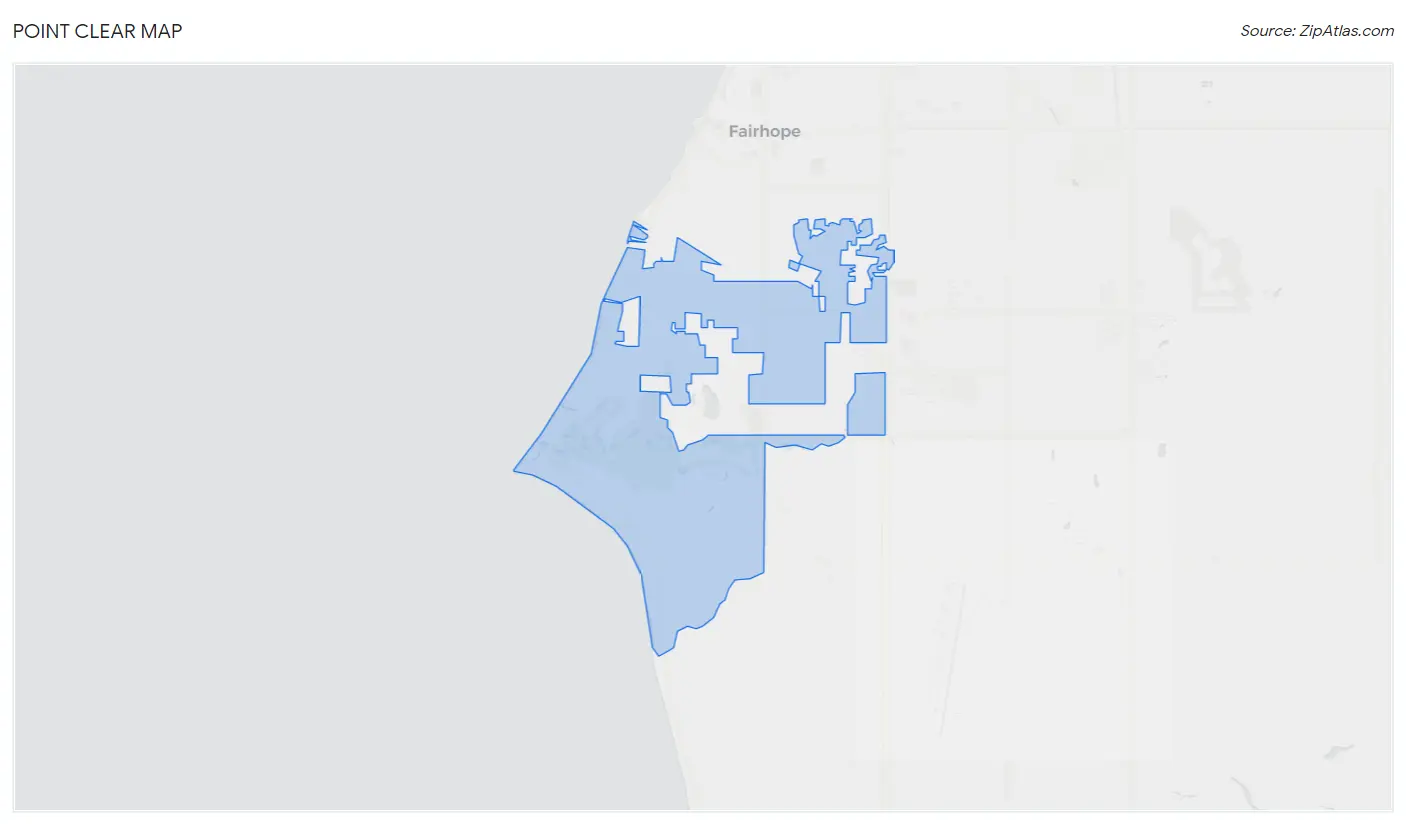
Point Clear Map
Point Clear Overview
1,755
TOTAL POPULATION
1,008
MALE POPULATION
747
FEMALE POPULATION
134.94
MALES / 100 FEMALES
74.11
FEMALES / 100 MALES
64.0
MEDIAN AGE
2.7
AVG FAMILY SIZE
2.1
AVG HOUSEHOLD SIZE
$91,727
PER CAPITA INCOME
$69,310
AVG HOUSEHOLD INCOME
0.66
INEQUALITY / GINI INDEX
430
LABOR FORCE [ PEOPLE ]
26.5%
PERCENT IN LABOR FORCE
Point Clear Area Codes
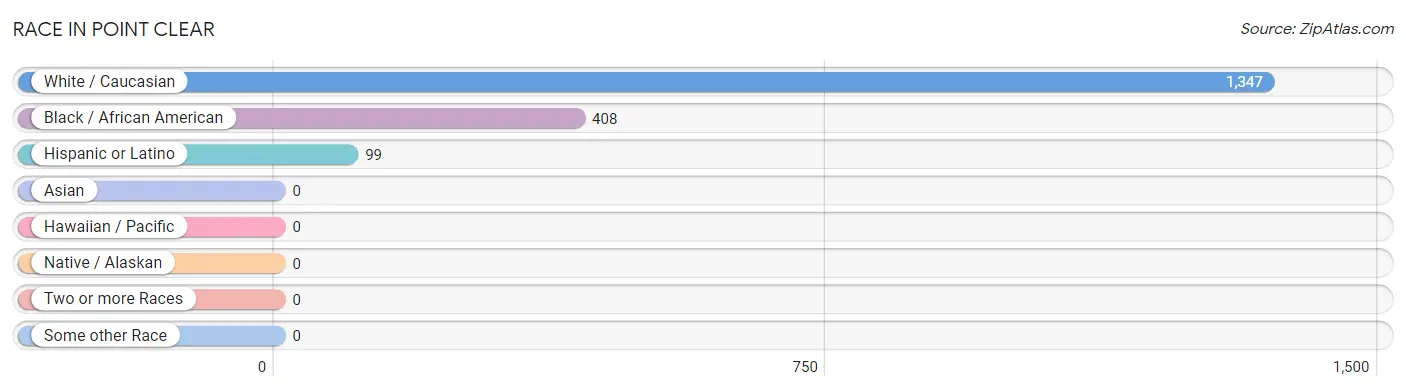
Race in Point Clear
The most populous races in Point Clear are White / Caucasian (1,347 | 76.7%), Black / African American (408 | 23.3%), and Hispanic or Latino (99 | 5.6%).
| Race | # Population | % Population |
| Asian | 0 | 0.0% |
| Black / African American | 408 | 23.3% |
| Hawaiian / Pacific | 0 | 0.0% |
| Hispanic or Latino | 99 | 5.6% |
| Native / Alaskan | 0 | 0.0% |
| White / Caucasian | 1,347 | 76.7% |
| Two or more Races | 0 | 0.0% |
| Some other Race | 0 | 0.0% |
| Total | 1,755 | 100.0% |
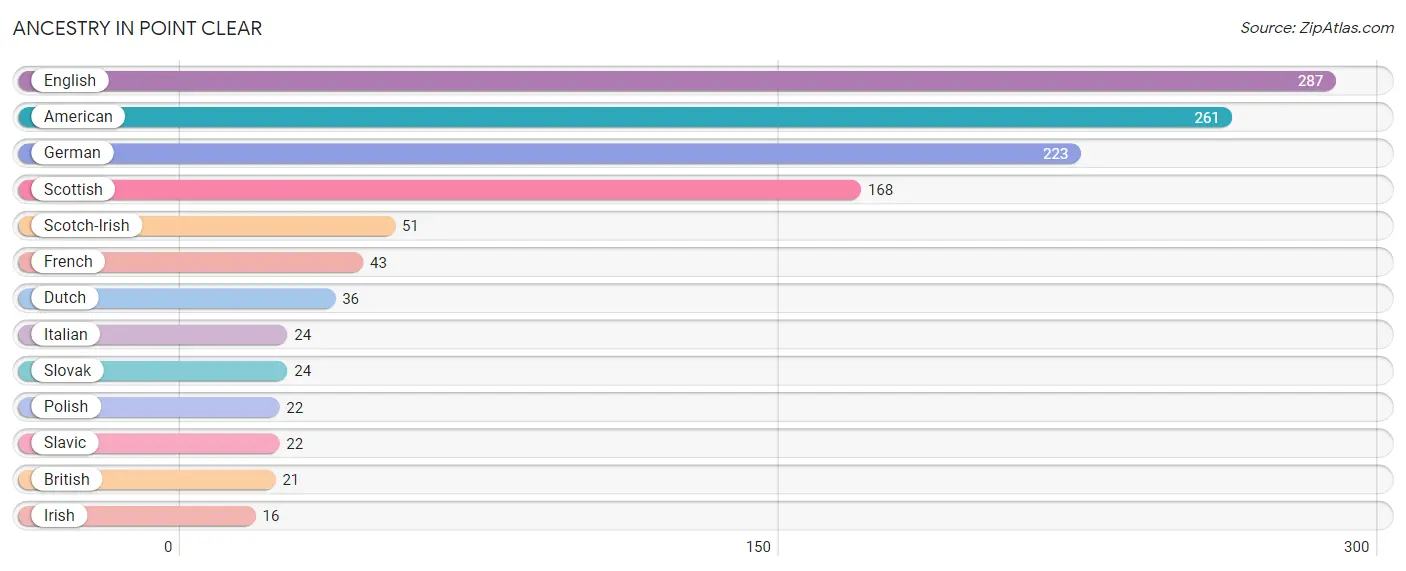
Ancestry in Point Clear
The most populous ancestries reported in Point Clear are English (287 | 16.4%), American (261 | 14.9%), German (223 | 12.7%), Scottish (168 | 9.6%), and Scotch-Irish (51 | 2.9%), together accounting for 56.4% of all Point Clear residents.
| Ancestry | # Population | % Population |
| American | 261 | 14.9% |
| British | 21 | 1.2% |
| Dutch | 36 | 2.1% |
| English | 287 | 16.4% |
| French | 43 | 2.5% |
| German | 223 | 12.7% |
| Irish | 16 | 0.9% |
| Italian | 24 | 1.4% |
| Polish | 22 | 1.3% |
| Scotch-Irish | 51 | 2.9% |
| Scottish | 168 | 9.6% |
| Slavic | 22 | 1.3% |
| Slovak | 24 | 1.4% | View All 13 Rows |
Immigrants in Point Clear

| Immigration Origin | # Population | % Population | View All 0 Rows |
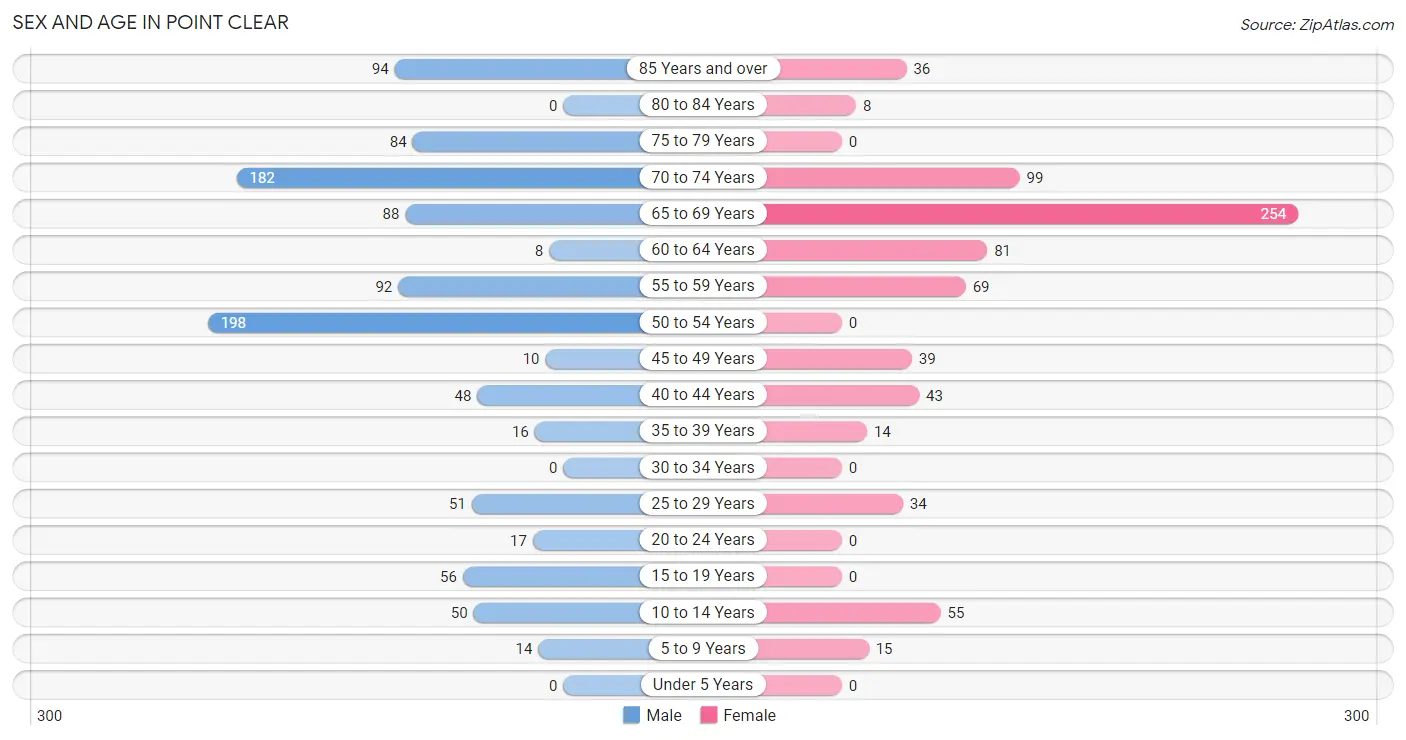
Sex and Age in Point Clear
Sex and Age in Point Clear
The most populous age groups in Point Clear are 50 to 54 Years (198 | 19.6%) for men and 65 to 69 Years (254 | 34.0%) for women.
| Age Bracket | Male | Female |
| Under 5 Years | 0 (0.0%) | 0 (0.0%) |
| 5 to 9 Years | 14 (1.4%) | 15 (2.0%) |
| 10 to 14 Years | 50 (5.0%) | 55 (7.4%) |
| 15 to 19 Years | 56 (5.6%) | 0 (0.0%) |
| 20 to 24 Years | 17 (1.7%) | 0 (0.0%) |
| 25 to 29 Years | 51 (5.1%) | 34 (4.5%) |
| 30 to 34 Years | 0 (0.0%) | 0 (0.0%) |
| 35 to 39 Years | 16 (1.6%) | 14 (1.9%) |
| 40 to 44 Years | 48 (4.8%) | 43 (5.8%) |
| 45 to 49 Years | 10 (1.0%) | 39 (5.2%) |
| 50 to 54 Years | 198 (19.6%) | 0 (0.0%) |
| 55 to 59 Years | 92 (9.1%) | 69 (9.2%) |
| 60 to 64 Years | 8 (0.8%) | 81 (10.8%) |
| 65 to 69 Years | 88 (8.7%) | 254 (34.0%) |
| 70 to 74 Years | 182 (18.1%) | 99 (13.3%) |
| 75 to 79 Years | 84 (8.3%) | 0 (0.0%) |
| 80 to 84 Years | 0 (0.0%) | 8 (1.1%) |
| 85 Years and over | 94 (9.3%) | 36 (4.8%) |
| Total | 1,008 (100.0%) | 747 (100.0%) |
Families and Households in Point Clear
Median Family Size in Point Clear
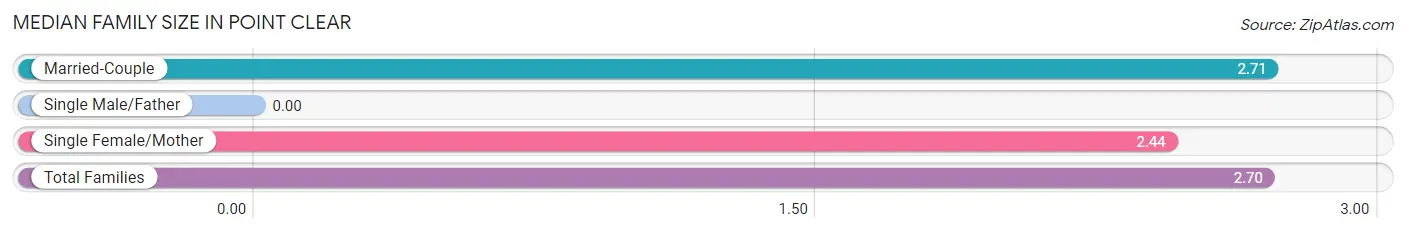
| Family Type | # Families | Family Size |
| Married-Couple | 516 (95.4%) | 2.71 |
| Single Male/Father | 0 (0.0%) | - |
| Single Female/Mother | 25 (4.6%) | 2.44 |
| Total Families | 541 (100.0%) | 2.70 |
Median Household Size in Point Clear
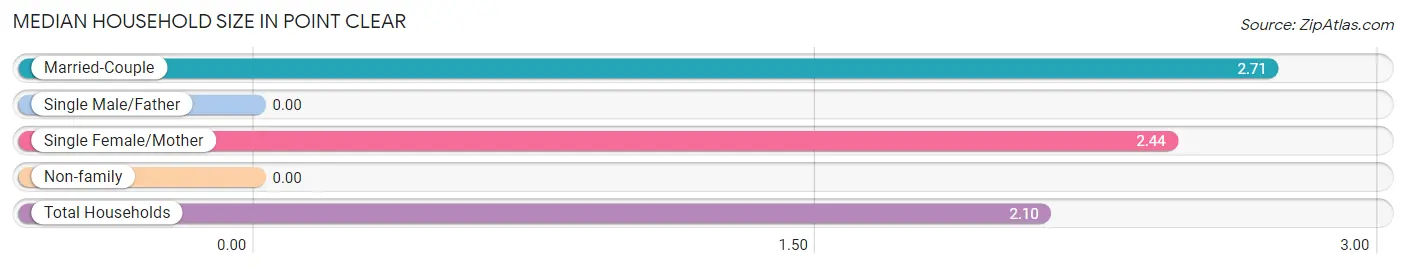
| Household Type | # Households | Household Size |
| Married-Couple | 516 (61.7%) | 2.71 |
| Single Male/Father | 0 (0.0%) | - |
| Single Female/Mother | 25 (3.0%) | 2.44 |
| Non-family | 295 (35.3%) | - |
| Total Households | 836 (100.0%) | 2.10 |
Household Size by Marriage Status in Point Clear
Out of a total of 836 households in Point Clear, 541 (64.7%) are family households, while 295 (35.3%) are nonfamily households. The most numerous type of family households are 2-person households, comprising 385, and the most common type of nonfamily households are 1-person households, comprising 295.
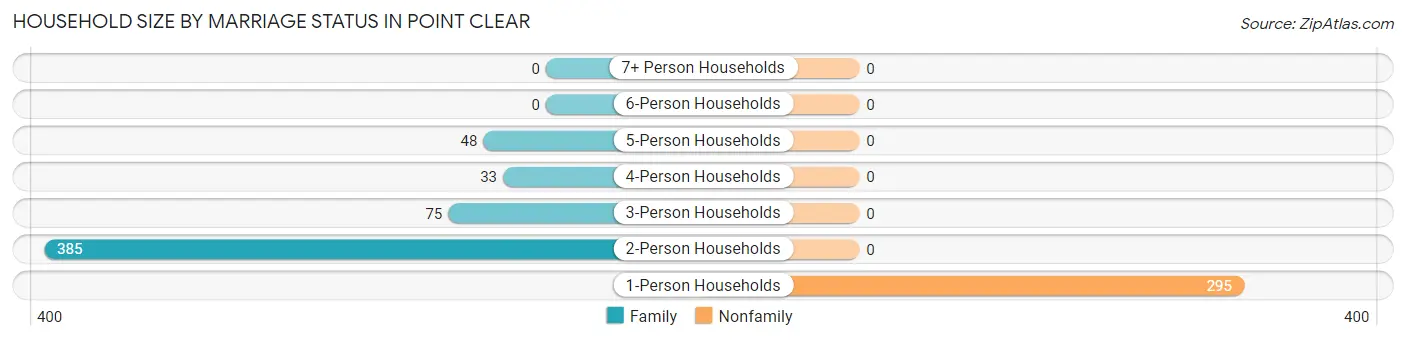
| Household Size | Family Households | Nonfamily Households |
| 1-Person Households | - | 295 (35.3%) |
| 2-Person Households | 385 (46.1%) | 0 (0.0%) |
| 3-Person Households | 75 (9.0%) | 0 (0.0%) |
| 4-Person Households | 33 (4.0%) | 0 (0.0%) |
| 5-Person Households | 48 (5.7%) | 0 (0.0%) |
| 6-Person Households | 0 (0.0%) | 0 (0.0%) |
| 7+ Person Households | 0 (0.0%) | 0 (0.0%) |
| Total | 541 (64.7%) | 295 (35.3%) |
Female Fertility in Point Clear
Fertility by Age in Point Clear
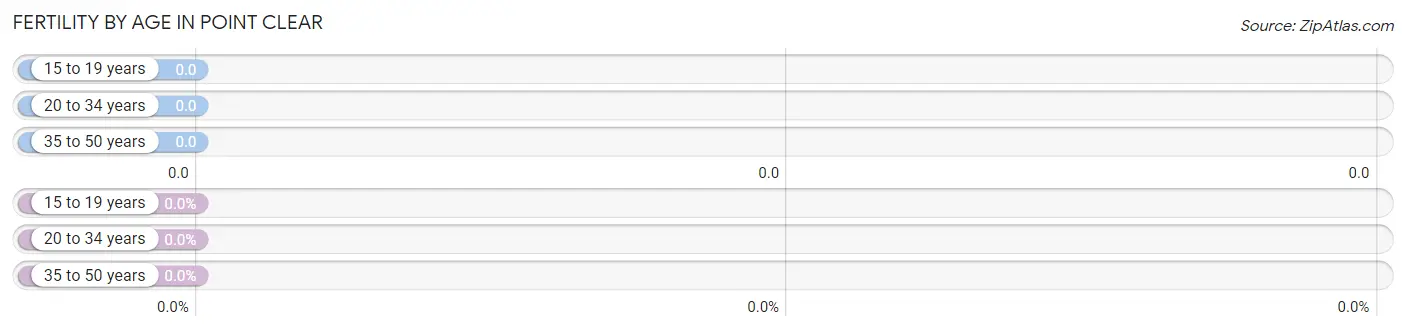
| Age Bracket | Women with Births | Births / 1,000 Women |
| 15 to 19 years | 0 (0.0%) | 0.0 |
| 20 to 34 years | 0 (0.0%) | 0.0 |
| 35 to 50 years | 0 (0.0%) | 0.0 |
| Total | 0 (0.0%) | 0.0 |
Fertility by Age by Marriage Status in Point Clear
| Age Bracket | Married | Unmarried |
| 15 to 19 years | 0 (0.0%) | 0 (0.0%) |
| 20 to 34 years | 0 (0.0%) | 0 (0.0%) |
| 35 to 50 years | 0 (0.0%) | 0 (0.0%) |
| Total | 0 (0.0%) | 0 (0.0%) |
Fertility by Education in Point Clear
| Educational Attainment | Women with Births | Births / 1,000 Women |
| Less than High School | 0 (0.0%) | 0.0 |
| High School Diploma | 0 (0.0%) | 0.0 |
| College or Associate's Degree | 0 (0.0%) | 0.0 |
| Bachelor's Degree | 0 (0.0%) | 0.0 |
| Graduate Degree | 0 (0.0%) | 0.0 |
| Total | 0 (0.0%) | 0.0 |
Fertility by Education by Marriage Status in Point Clear
| Educational Attainment | Married | Unmarried |
| Less than High School | 0 (0.0%) | 0 (0.0%) |
| High School Diploma | 0 (0.0%) | 0 (0.0%) |
| College or Associate's Degree | 0 (0.0%) | 0 (0.0%) |
| Bachelor's Degree | 0 (0.0%) | 0 (0.0%) |
| Graduate Degree | 0 (0.0%) | 0 (0.0%) |
| Total | 0 (0.0%) | 0 (0.0%) |
Income in Point Clear
Income Overview in Point Clear
| Characteristic | Number | Measure |
| Per Capita Income | 1,755 | $91,727 |
| Median Family Income | 541 | $0 |
| Mean Family Income | 541 | $274,383 |
| Median Household Income | 836 | $69,310 |
| Mean Household Income | 836 | $185,258 |
| Income Deficit | 541 | $0 |
| Wage / Income Gap (%) | 1,755 | 0.00% |
| Wage / Income Gap ($) | 1,755 | 100.00¢ per $1 |
| Gini / Inequality Index | 1,755 | 0.66 |
Earnings by Sex in Point Clear
| Sex | Number | Average Earnings |
| Male | 324 (70.7%) | $0 |
| Female | 134 (29.3%) | $0 |
| Total | 458 (100.0%) | $0 |
Earnings by Sex by Income Bracket in Point Clear
The most common earnings brackets in Point Clear are $100,000+ for men (146 | 45.1%) and $100,000+ for women (43 | 32.1%).
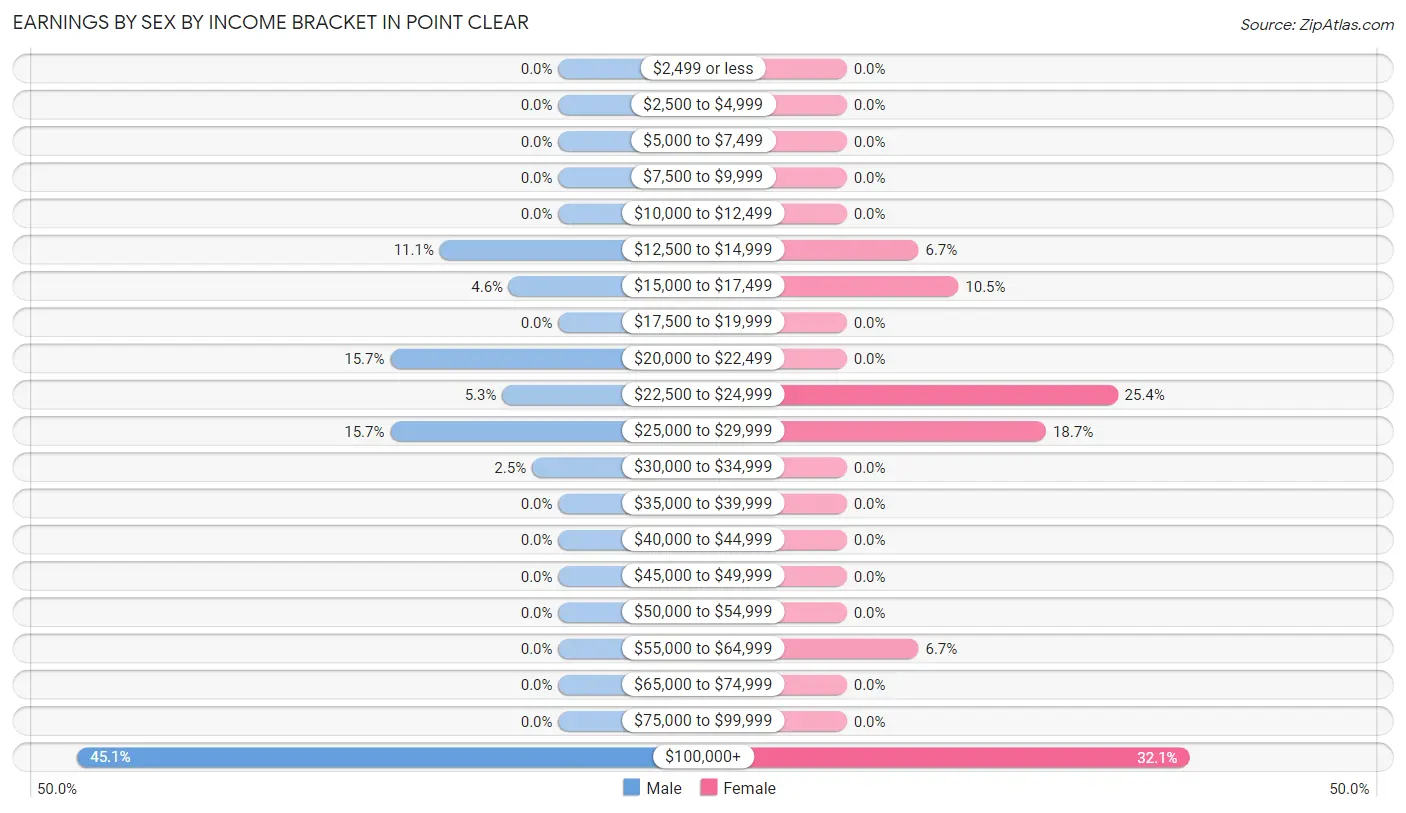
| Income | Male | Female |
| $2,499 or less | 0 (0.0%) | 0 (0.0%) |
| $2,500 to $4,999 | 0 (0.0%) | 0 (0.0%) |
| $5,000 to $7,499 | 0 (0.0%) | 0 (0.0%) |
| $7,500 to $9,999 | 0 (0.0%) | 0 (0.0%) |
| $10,000 to $12,499 | 0 (0.0%) | 0 (0.0%) |
| $12,500 to $14,999 | 36 (11.1%) | 9 (6.7%) |
| $15,000 to $17,499 | 15 (4.6%) | 14 (10.4%) |
| $17,500 to $19,999 | 0 (0.0%) | 0 (0.0%) |
| $20,000 to $22,499 | 51 (15.7%) | 0 (0.0%) |
| $22,500 to $24,999 | 17 (5.2%) | 34 (25.4%) |
| $25,000 to $29,999 | 51 (15.7%) | 25 (18.7%) |
| $30,000 to $34,999 | 8 (2.5%) | 0 (0.0%) |
| $35,000 to $39,999 | 0 (0.0%) | 0 (0.0%) |
| $40,000 to $44,999 | 0 (0.0%) | 0 (0.0%) |
| $45,000 to $49,999 | 0 (0.0%) | 0 (0.0%) |
| $50,000 to $54,999 | 0 (0.0%) | 0 (0.0%) |
| $55,000 to $64,999 | 0 (0.0%) | 9 (6.7%) |
| $65,000 to $74,999 | 0 (0.0%) | 0 (0.0%) |
| $75,000 to $99,999 | 0 (0.0%) | 0 (0.0%) |
| $100,000+ | 146 (45.1%) | 43 (32.1%) |
| Total | 324 (100.0%) | 134 (100.0%) |
Earnings by Sex by Educational Attainment in Point Clear
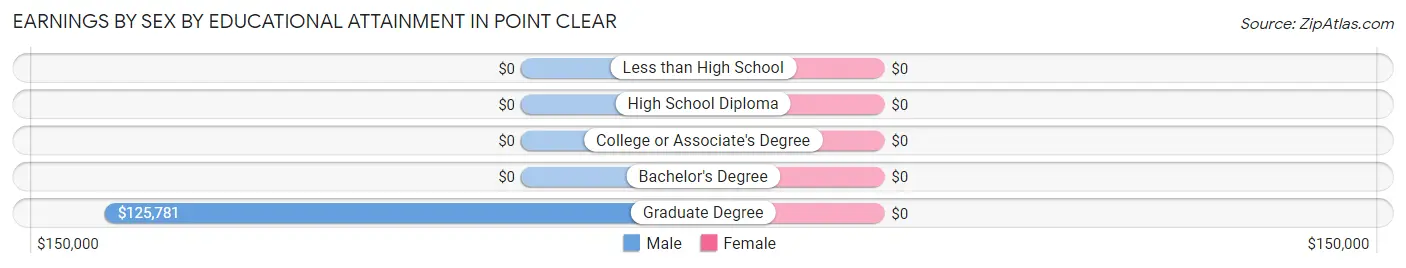
| Educational Attainment | Male Income | Female Income |
| Less than High School | - | - |
| High School Diploma | - | - |
| College or Associate's Degree | - | - |
| Bachelor's Degree | - | - |
| Graduate Degree | $125,781 | $0 |
| Total | - | - |
Family Income in Point Clear
Family Income Brackets in Point Clear
According to the Point Clear family income data, there are 239 families falling into the $200,000+ income range, which is the most common income bracket and makes up 44.2% of all families.
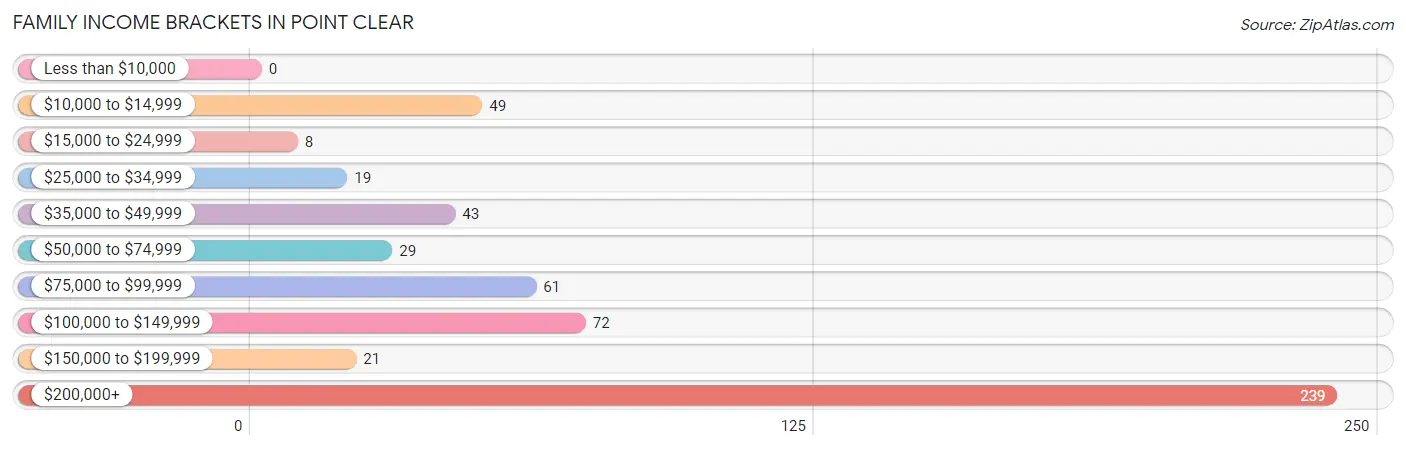
| Income Bracket | # Families | % Families |
| Less than $10,000 | 0 | 0.0% |
| $10,000 to $14,999 | 49 | 9.1% |
| $15,000 to $24,999 | 8 | 1.5% |
| $25,000 to $34,999 | 19 | 3.5% |
| $35,000 to $49,999 | 43 | 7.9% |
| $50,000 to $74,999 | 29 | 5.4% |
| $75,000 to $99,999 | 61 | 11.3% |
| $100,000 to $149,999 | 72 | 13.3% |
| $150,000 to $199,999 | 21 | 3.9% |
| $200,000+ | 239 | 44.2% |
Family Income by Famaliy Size in Point Clear
4-person families (33 | 6.1%) account for the highest median family income in Point Clear with $212,656 per family, while 4-person families (33 | 6.1%) have the highest median income of $53,164 per family member.
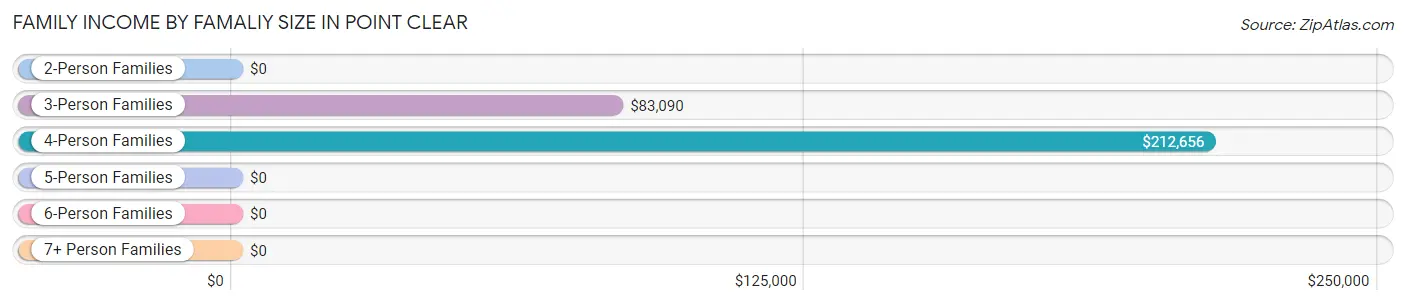
| Income Bracket | # Families | Median Income |
| 2-Person Families | 385 (71.2%) | $0 |
| 3-Person Families | 75 (13.9%) | $83,090 |
| 4-Person Families | 33 (6.1%) | $212,656 |
| 5-Person Families | 48 (8.9%) | $0 |
| 6-Person Families | 0 (0.0%) | $0 |
| 7+ Person Families | 0 (0.0%) | $0 |
| Total | 541 (100.0%) | $0 |
Family Income by Number of Earners in Point Clear
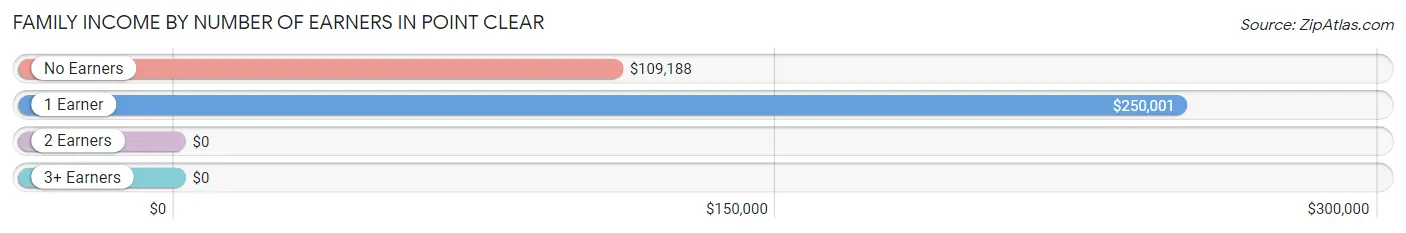
| Number of Earners | # Families | Median Income |
| No Earners | 321 (59.3%) | $109,188 |
| 1 Earner | 85 (15.7%) | $250,001 |
| 2 Earners | 135 (24.9%) | $0 |
| 3+ Earners | 0 (0.0%) | $0 |
| Total | 541 (100.0%) | $0 |
Household Income in Point Clear
Household Income Brackets in Point Clear
With 239 households falling in the category, the $200,000+ income range is the most frequent in Point Clear, accounting for 28.6% of all households. In contrast, only 8 households (1.0%) fall into the $15,000 to $24,999 income bracket, making it the least populous group.
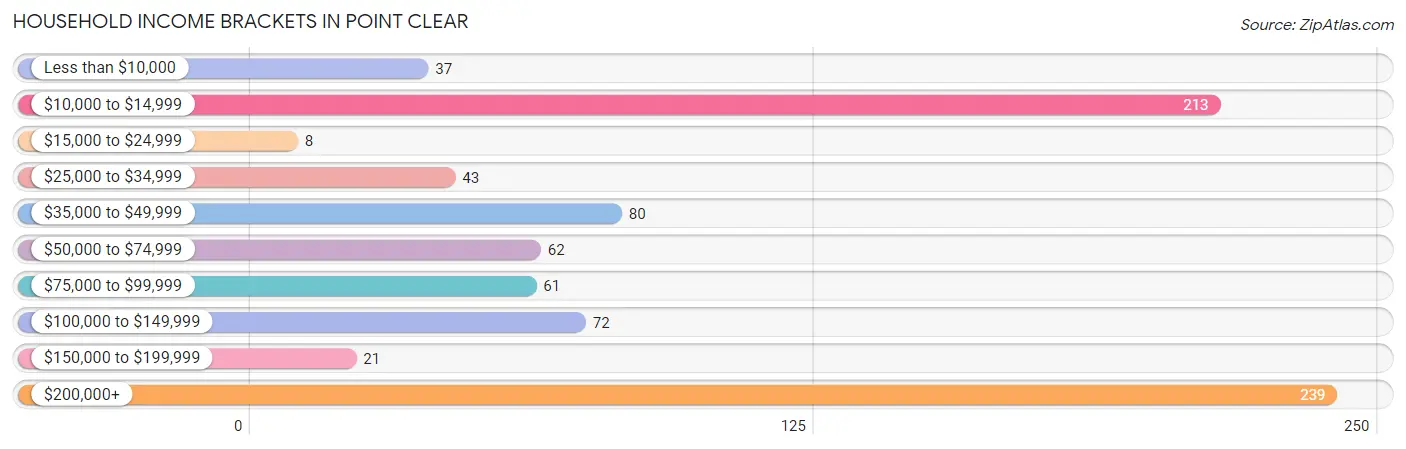
| Income Bracket | # Households | % Households |
| Less than $10,000 | 37 | 4.4% |
| $10,000 to $14,999 | 213 | 25.5% |
| $15,000 to $24,999 | 8 | 1.0% |
| $25,000 to $34,999 | 43 | 5.1% |
| $35,000 to $49,999 | 80 | 9.6% |
| $50,000 to $74,999 | 62 | 7.4% |
| $75,000 to $99,999 | 61 | 7.3% |
| $100,000 to $149,999 | 72 | 8.6% |
| $150,000 to $199,999 | 21 | 2.5% |
| $200,000+ | 239 | 28.6% |
Household Income by Householder Age in Point Clear
The median household income in Point Clear is $69,310, with the highest median household income of $108,625 found in the 65+ years age bracket for the primary householder. A total of 436 households (52.1%) fall into this category.
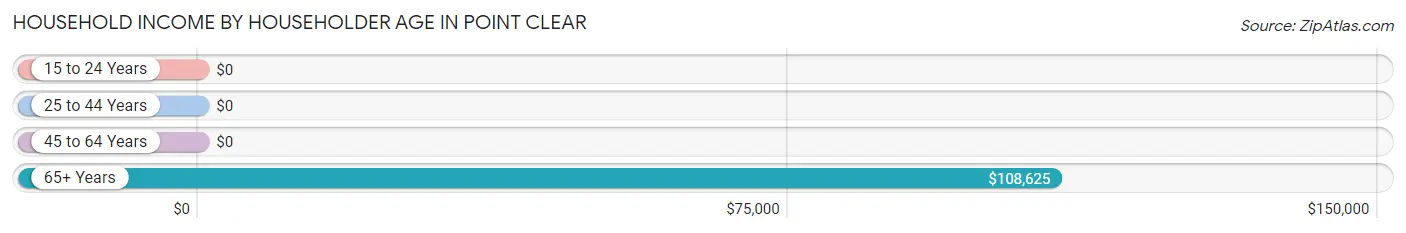
| Income Bracket | # Households | Median Income |
| 15 to 24 Years | 0 (0.0%) | $0 |
| 25 to 44 Years | 64 (7.7%) | $0 |
| 45 to 64 Years | 336 (40.2%) | $0 |
| 65+ Years | 436 (52.1%) | $108,625 |
| Total | 836 (100.0%) | $69,310 |
Poverty in Point Clear
Income Below Poverty by Sex and Age in Point Clear
With 21.1% poverty level for males and 11.7% for females among the residents of Point Clear, 45 to 54 year old males and 55 to 64 year old females are the most vulnerable to poverty, with 142 males (68.3%) and 37 females (24.7%) in their respective age groups living below the poverty level.
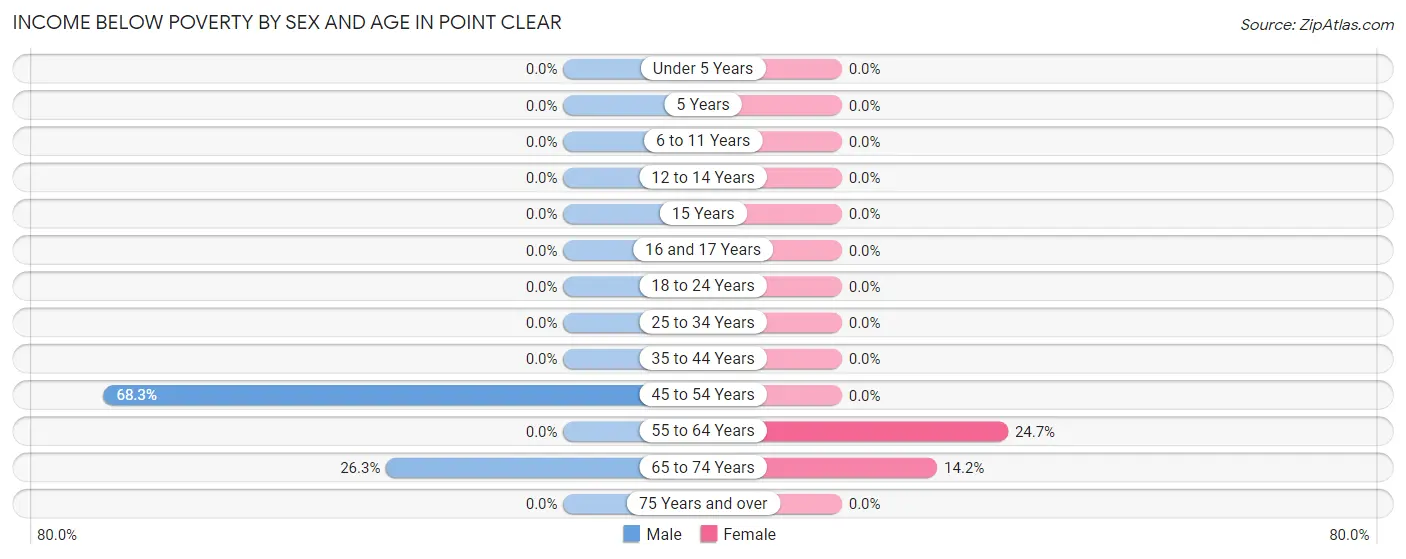
| Age Bracket | Male | Female |
| Under 5 Years | 0 (0.0%) | 0 (0.0%) |
| 5 Years | 0 (0.0%) | 0 (0.0%) |
| 6 to 11 Years | 0 (0.0%) | 0 (0.0%) |
| 12 to 14 Years | 0 (0.0%) | 0 (0.0%) |
| 15 Years | 0 (0.0%) | 0 (0.0%) |
| 16 and 17 Years | 0 (0.0%) | 0 (0.0%) |
| 18 to 24 Years | 0 (0.0%) | 0 (0.0%) |
| 25 to 34 Years | 0 (0.0%) | 0 (0.0%) |
| 35 to 44 Years | 0 (0.0%) | 0 (0.0%) |
| 45 to 54 Years | 142 (68.3%) | 0 (0.0%) |
| 55 to 64 Years | 0 (0.0%) | 37 (24.7%) |
| 65 to 74 Years | 71 (26.3%) | 50 (14.2%) |
| 75 Years and over | 0 (0.0%) | 0 (0.0%) |
| Total | 213 (21.1%) | 87 (11.7%) |
Income Above Poverty by Sex and Age in Point Clear
According to the poverty statistics in Point Clear, males aged 6 to 11 years and females aged 6 to 11 years are the age groups that are most secure financially, with 100.0% of males and 100.0% of females in these age groups living above the poverty line.
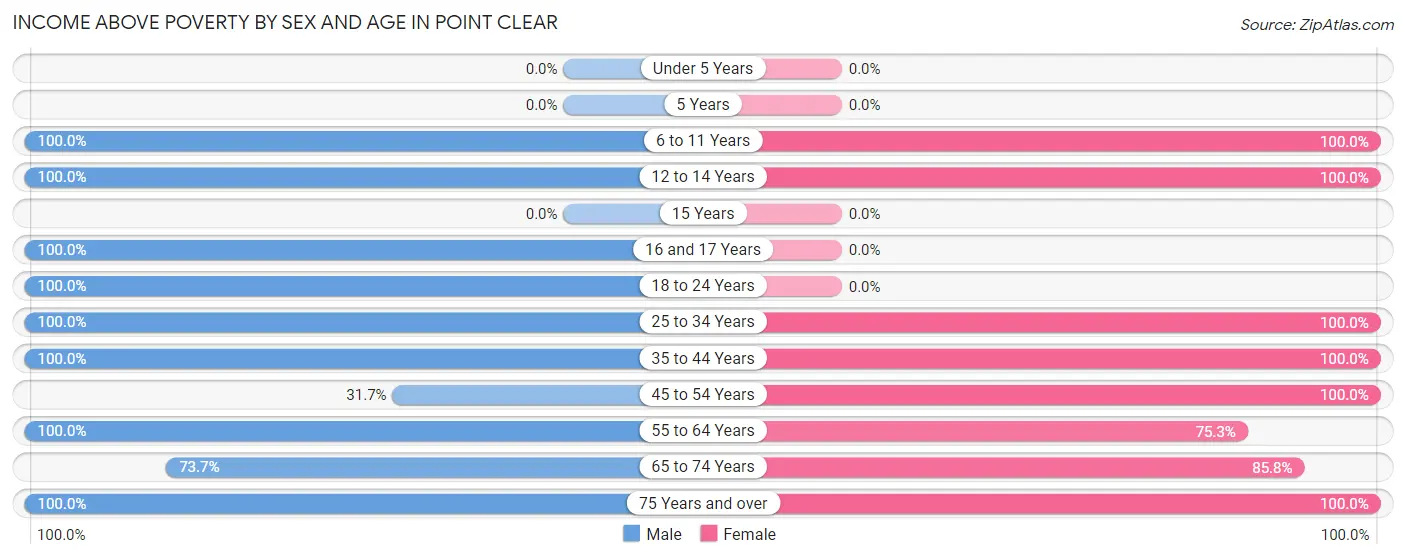
| Age Bracket | Male | Female |
| Under 5 Years | 0 (0.0%) | 0 (0.0%) |
| 5 Years | 0 (0.0%) | 0 (0.0%) |
| 6 to 11 Years | 14 (100.0%) | 24 (100.0%) |
| 12 to 14 Years | 50 (100.0%) | 46 (100.0%) |
| 15 Years | 0 (0.0%) | 0 (0.0%) |
| 16 and 17 Years | 56 (100.0%) | 0 (0.0%) |
| 18 to 24 Years | 17 (100.0%) | 0 (0.0%) |
| 25 to 34 Years | 51 (100.0%) | 34 (100.0%) |
| 35 to 44 Years | 64 (100.0%) | 57 (100.0%) |
| 45 to 54 Years | 66 (31.7%) | 39 (100.0%) |
| 55 to 64 Years | 100 (100.0%) | 113 (75.3%) |
| 65 to 74 Years | 199 (73.7%) | 303 (85.8%) |
| 75 Years and over | 178 (100.0%) | 44 (100.0%) |
| Total | 795 (78.9%) | 660 (88.3%) |
Income Below Poverty Among Married-Couple Families in Point Clear
The poverty statistics for married-couple families in Point Clear show that 9.5% or 49 of the total 516 families live below the poverty line. Families with no children have the highest poverty rate of 11.1%, comprising of 49 families. On the other hand, families with 1 or 2 children have the lowest poverty rate of 0.0%, which includes 0 families.
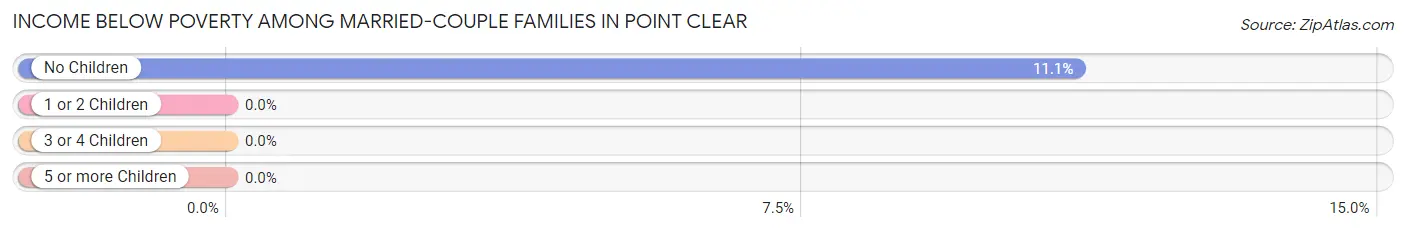
| Children | Above Poverty | Below Poverty |
| No Children | 394 (88.9%) | 49 (11.1%) |
| 1 or 2 Children | 25 (100.0%) | 0 (0.0%) |
| 3 or 4 Children | 48 (100.0%) | 0 (0.0%) |
| 5 or more Children | 0 (0.0%) | 0 (0.0%) |
| Total | 467 (90.5%) | 49 (9.5%) |
Income Below Poverty Among Single-Parent Households in Point Clear
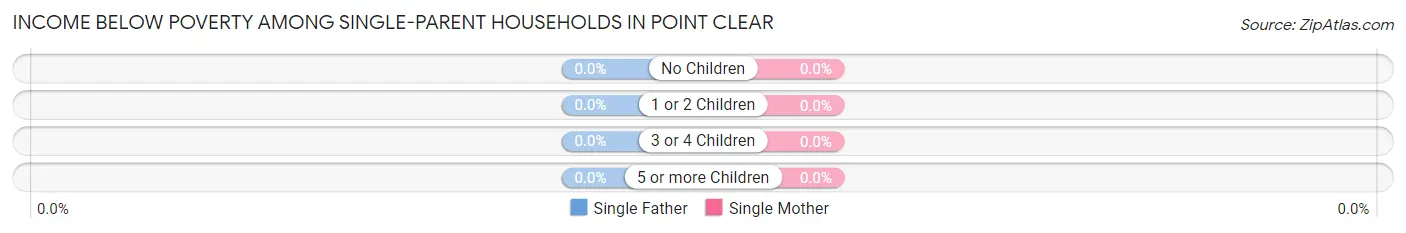
| Children | Single Father | Single Mother |
| No Children | 0 (0.0%) | 0 (0.0%) |
| 1 or 2 Children | 0 (0.0%) | 0 (0.0%) |
| 3 or 4 Children | 0 (0.0%) | 0 (0.0%) |
| 5 or more Children | 0 (0.0%) | 0 (0.0%) |
| Total | 0 (0.0%) | 0 (0.0%) |
Income Below Poverty Among Married-Couple vs Single-Parent Households in Point Clear
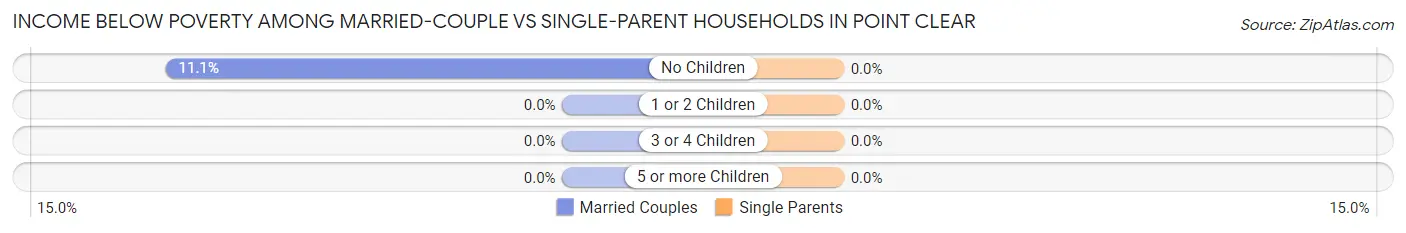
| Children | Married-Couple Families | Single-Parent Households |
| No Children | 49 (11.1%) | 0 (0.0%) |
| 1 or 2 Children | 0 (0.0%) | 0 (0.0%) |
| 3 or 4 Children | 0 (0.0%) | 0 (0.0%) |
| 5 or more Children | 0 (0.0%) | 0 (0.0%) |
| Total | 49 (9.5%) | 0 (0.0%) |
Employment Characteristics in Point Clear
Employment by Class of Employer in Point Clear
Among the 402 employed individuals in Point Clear, private company employees (247 | 61.4%), self-employed (incorporated) (60 | 14.9%), and self-employed (not incorporated) (47 | 11.7%) make up the most common classes of employment.
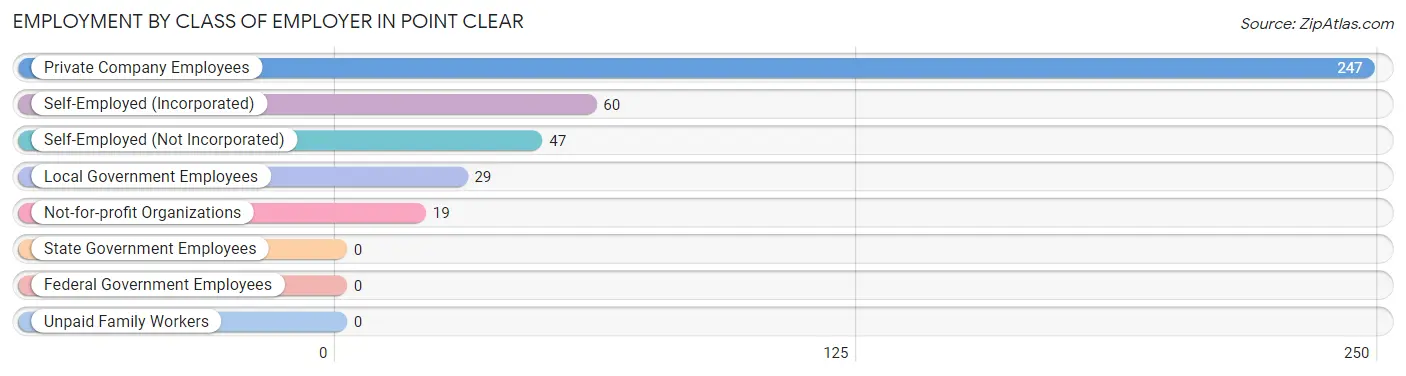
| Employer Class | # Employees | % Employees |
| Private Company Employees | 247 | 61.4% |
| Self-Employed (Incorporated) | 60 | 14.9% |
| Self-Employed (Not Incorporated) | 47 | 11.7% |
| Not-for-profit Organizations | 19 | 4.7% |
| Local Government Employees | 29 | 7.2% |
| State Government Employees | 0 | 0.0% |
| Federal Government Employees | 0 | 0.0% |
| Unpaid Family Workers | 0 | 0.0% |
| Total | 402 | 100.0% |
Employment Status by Age in Point Clear
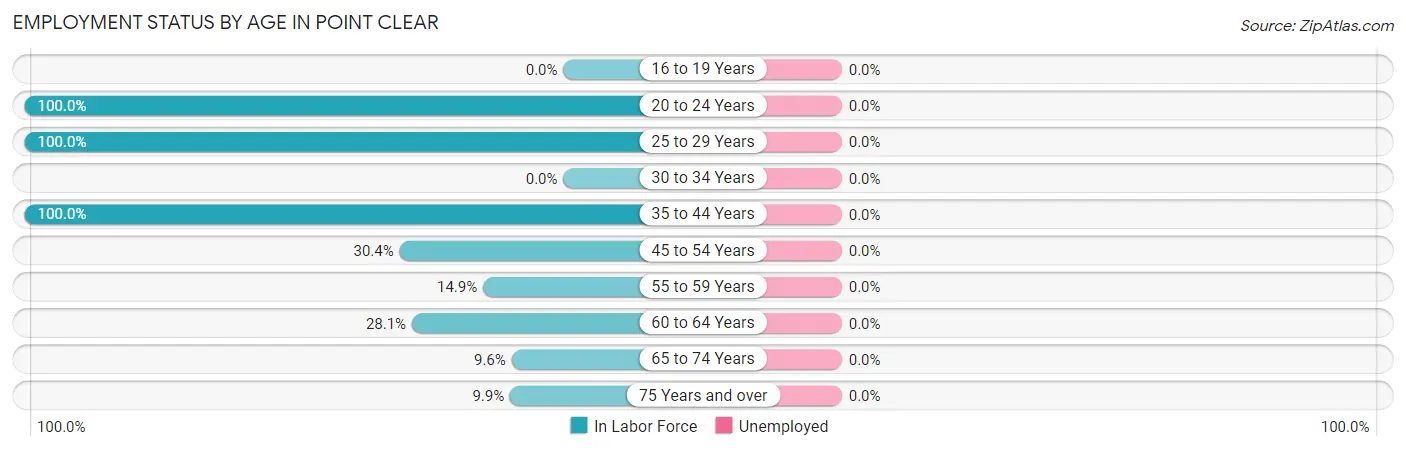
| Age Bracket | In Labor Force | Unemployed |
| 16 to 19 Years | 0 (0.0%) | 0 (0.0%) |
| 20 to 24 Years | 17 (100.0%) | 0 (0.0%) |
| 25 to 29 Years | 85 (100.0%) | 0 (0.0%) |
| 30 to 34 Years | 0 (0.0%) | 0 (0.0%) |
| 35 to 44 Years | 121 (100.0%) | 0 (0.0%) |
| 45 to 54 Years | 75 (30.4%) | 0 (0.0%) |
| 55 to 59 Years | 24 (14.9%) | 0 (0.0%) |
| 60 to 64 Years | 25 (28.1%) | 0 (0.0%) |
| 65 to 74 Years | 60 (9.6%) | 0 (0.0%) |
| 75 Years and over | 22 (9.9%) | 0 (0.0%) |
| Total | 430 (26.5%) | 0 (0.0%) |
Employment Status by Educational Attainment in Point Clear
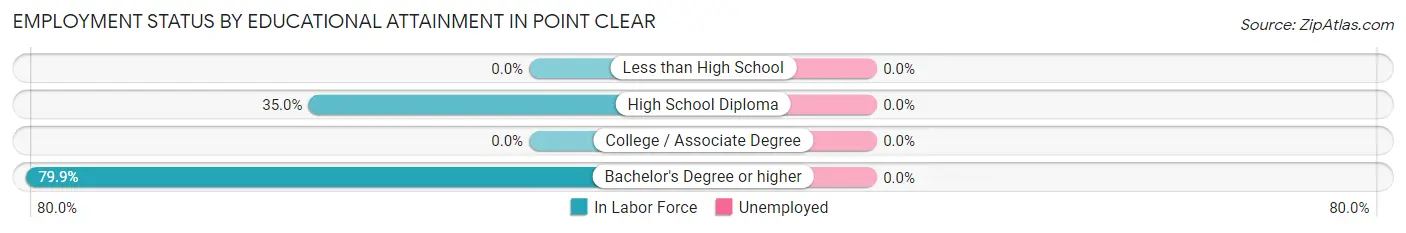
| Educational Attainment | In Labor Force | Unemployed |
| Less than High School | 0 (0.0%) | 0 (0.0%) |
| High School Diploma | 107 (35.0%) | 0 (0.0%) |
| College / Associate Degree | 0 (0.0%) | 0 (0.0%) |
| Bachelor's Degree or higher | 223 (79.9%) | 0 (0.0%) |
| Total | 330 (46.9%) | 0 (0.0%) |
Employment Occupations by Sex in Point Clear
Management, Business, Science and Arts Occupations
The most common Management, Business, Science and Arts occupations in Point Clear are Community & Social Service (109 | 25.4%), Legal Services & Support (82 | 19.1%), Health Diagnosing & Treating (68 | 15.9%), Health Technologists (68 | 15.9%), and Arts, Media & Entertainment (27 | 6.3%).
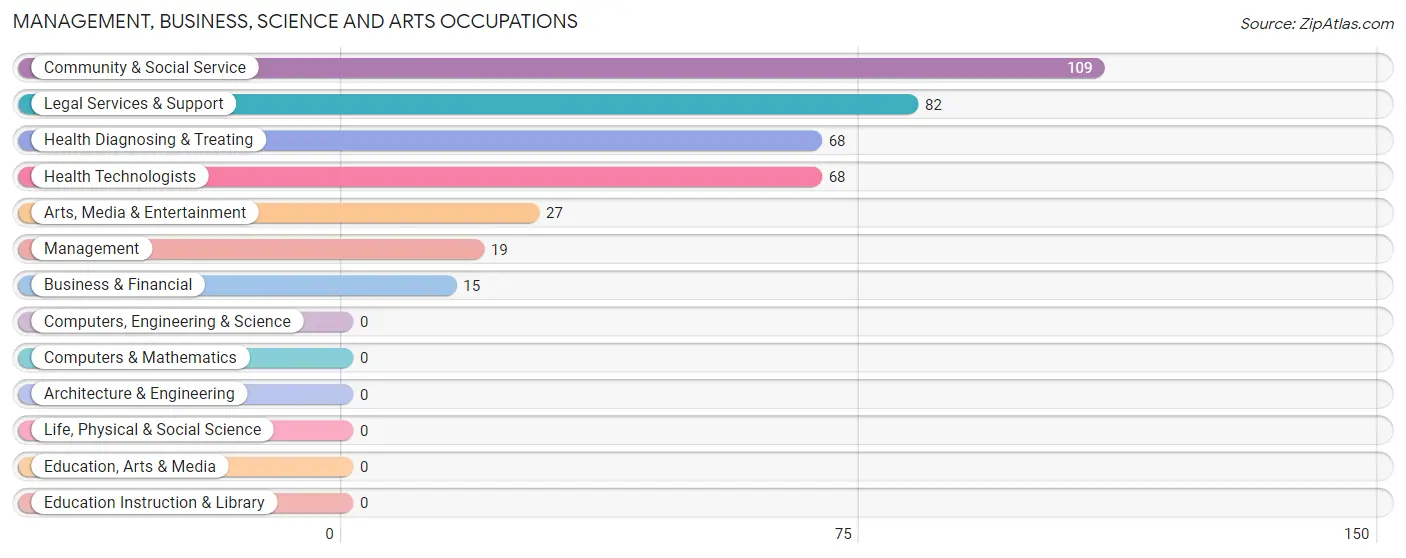
Management, Business, Science and Arts Occupations by Sex
Within the Management, Business, Science and Arts occupations in Point Clear, the most male-oriented occupations are Business & Financial (100.0%), Community & Social Service (100.0%), and Legal Services & Support (100.0%), while the most female-oriented occupations are Health Diagnosing & Treating (100.0%), Health Technologists (100.0%), and Management (47.4%).
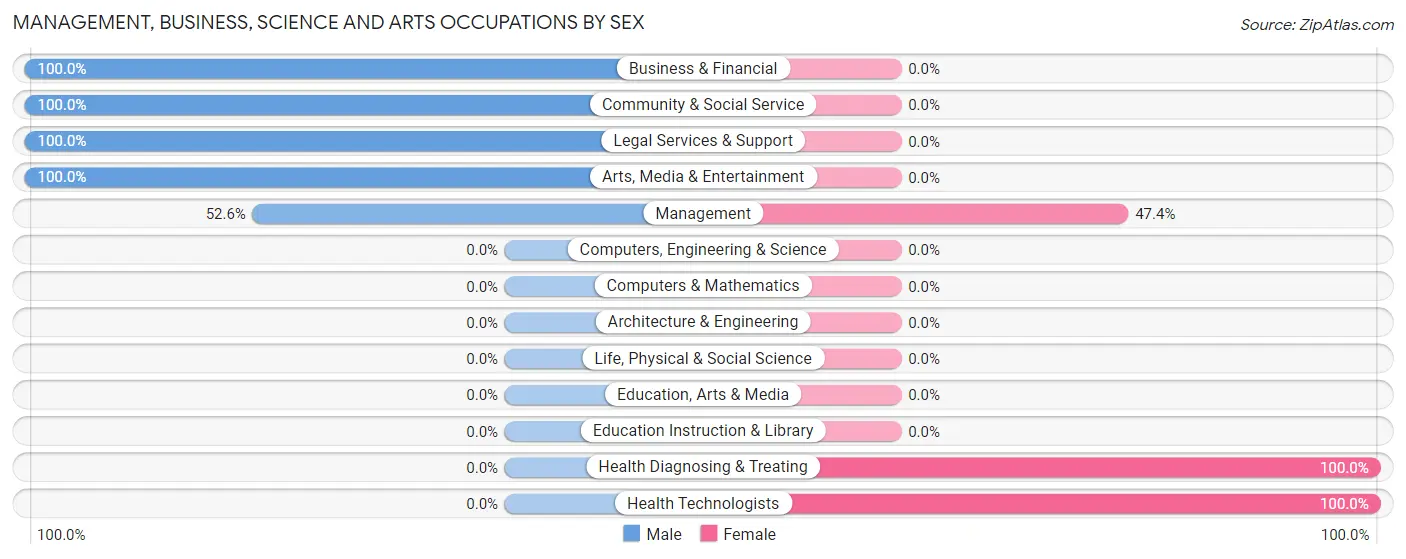
| Occupation | Male | Female |
| Management | 10 (52.6%) | 9 (47.4%) |
| Business & Financial | 15 (100.0%) | 0 (0.0%) |
| Computers, Engineering & Science | 0 (0.0%) | 0 (0.0%) |
| Computers & Mathematics | 0 (0.0%) | 0 (0.0%) |
| Architecture & Engineering | 0 (0.0%) | 0 (0.0%) |
| Life, Physical & Social Science | 0 (0.0%) | 0 (0.0%) |
| Community & Social Service | 109 (100.0%) | 0 (0.0%) |
| Education, Arts & Media | 0 (0.0%) | 0 (0.0%) |
| Legal Services & Support | 82 (100.0%) | 0 (0.0%) |
| Education Instruction & Library | 0 (0.0%) | 0 (0.0%) |
| Arts, Media & Entertainment | 27 (100.0%) | 0 (0.0%) |
| Health Diagnosing & Treating | 0 (0.0%) | 68 (100.0%) |
| Health Technologists | 0 (0.0%) | 68 (100.0%) |
| Total (Category) | 134 (63.5%) | 77 (36.5%) |
| Total (Overall) | 295 (68.8%) | 134 (31.2%) |
Services Occupations
Services Occupations by Sex
| Occupation | Male | Female |
| Healthcare Support | 0 (0.0%) | 0 (0.0%) |
| Security & Protection | 0 (0.0%) | 0 (0.0%) |
| Firefighting & Prevention | 0 (0.0%) | 0 (0.0%) |
| Law Enforcement | 0 (0.0%) | 0 (0.0%) |
| Food Preparation & Serving | 0 (0.0%) | 0 (0.0%) |
| Cleaning & Maintenance | 0 (0.0%) | 0 (0.0%) |
| Personal Care & Service | 0 (0.0%) | 0 (0.0%) |
| Total (Category) | 0 (0.0%) | 0 (0.0%) |
| Total (Overall) | 295 (68.8%) | 134 (31.2%) |
Sales and Office Occupations
The most common Sales and Office occupations in Point Clear are Office & Administration (51 | 11.9%), and Sales & Related (14 | 3.3%).
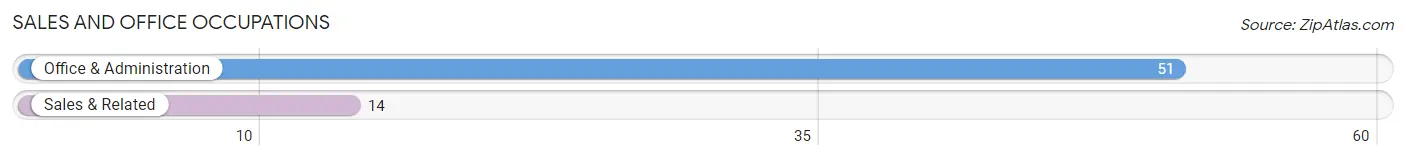
Sales and Office Occupations by Sex
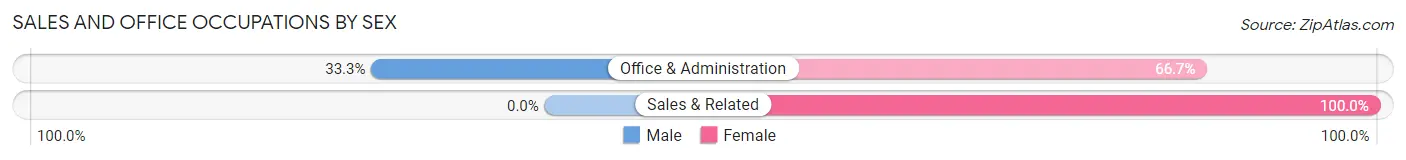
| Occupation | Male | Female |
| Sales & Related | 0 (0.0%) | 14 (100.0%) |
| Office & Administration | 17 (33.3%) | 34 (66.7%) |
| Total (Category) | 17 (26.2%) | 48 (73.9%) |
| Total (Overall) | 295 (68.8%) | 134 (31.2%) |
Natural Resources, Construction and Maintenance Occupations
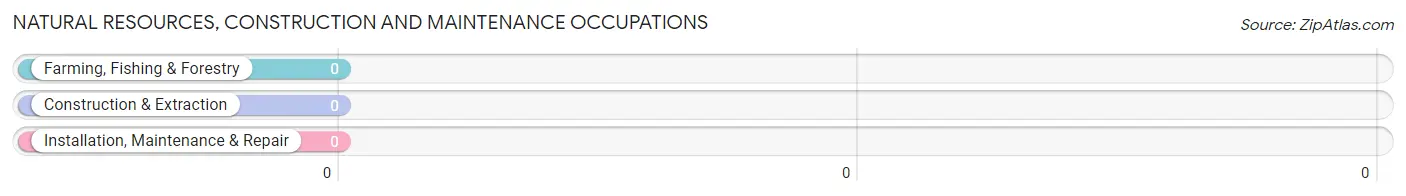
Natural Resources, Construction and Maintenance Occupations by Sex
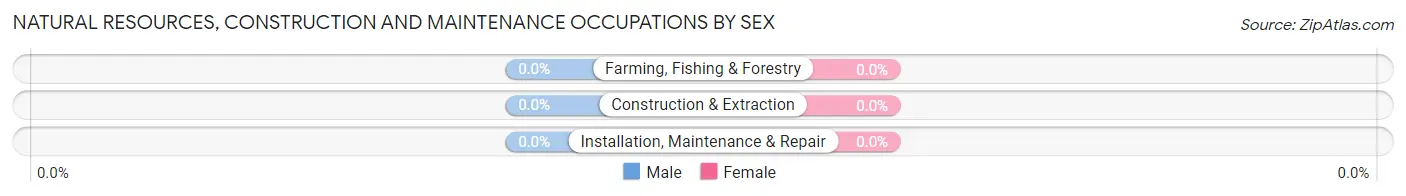
| Occupation | Male | Female |
| Farming, Fishing & Forestry | 0 (0.0%) | 0 (0.0%) |
| Construction & Extraction | 0 (0.0%) | 0 (0.0%) |
| Installation, Maintenance & Repair | 0 (0.0%) | 0 (0.0%) |
| Total (Category) | 0 (0.0%) | 0 (0.0%) |
| Total (Overall) | 295 (68.8%) | 134 (31.2%) |
Production, Transportation and Moving Occupations
The most common Production, Transportation and Moving occupations in Point Clear are Transportation (64 | 14.9%), Material Moving (60 | 14.0%), and Production (29 | 6.8%).

Production, Transportation and Moving Occupations by Sex
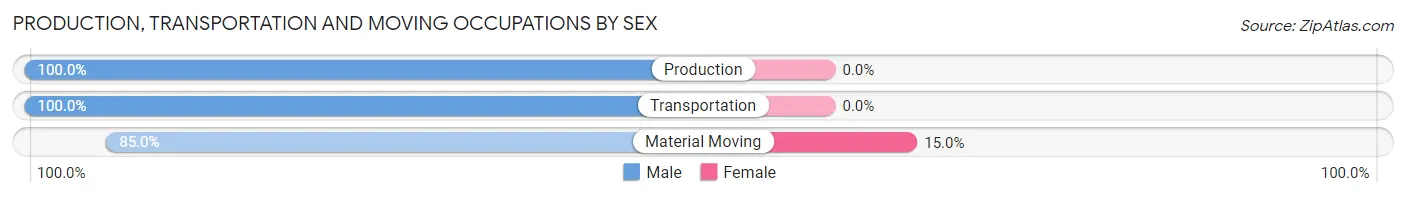
| Occupation | Male | Female |
| Production | 29 (100.0%) | 0 (0.0%) |
| Transportation | 64 (100.0%) | 0 (0.0%) |
| Material Moving | 51 (85.0%) | 9 (15.0%) |
| Total (Category) | 144 (94.1%) | 9 (5.9%) |
| Total (Overall) | 295 (68.8%) | 134 (31.2%) |
Employment Industries by Sex in Point Clear
Employment Industries in Point Clear
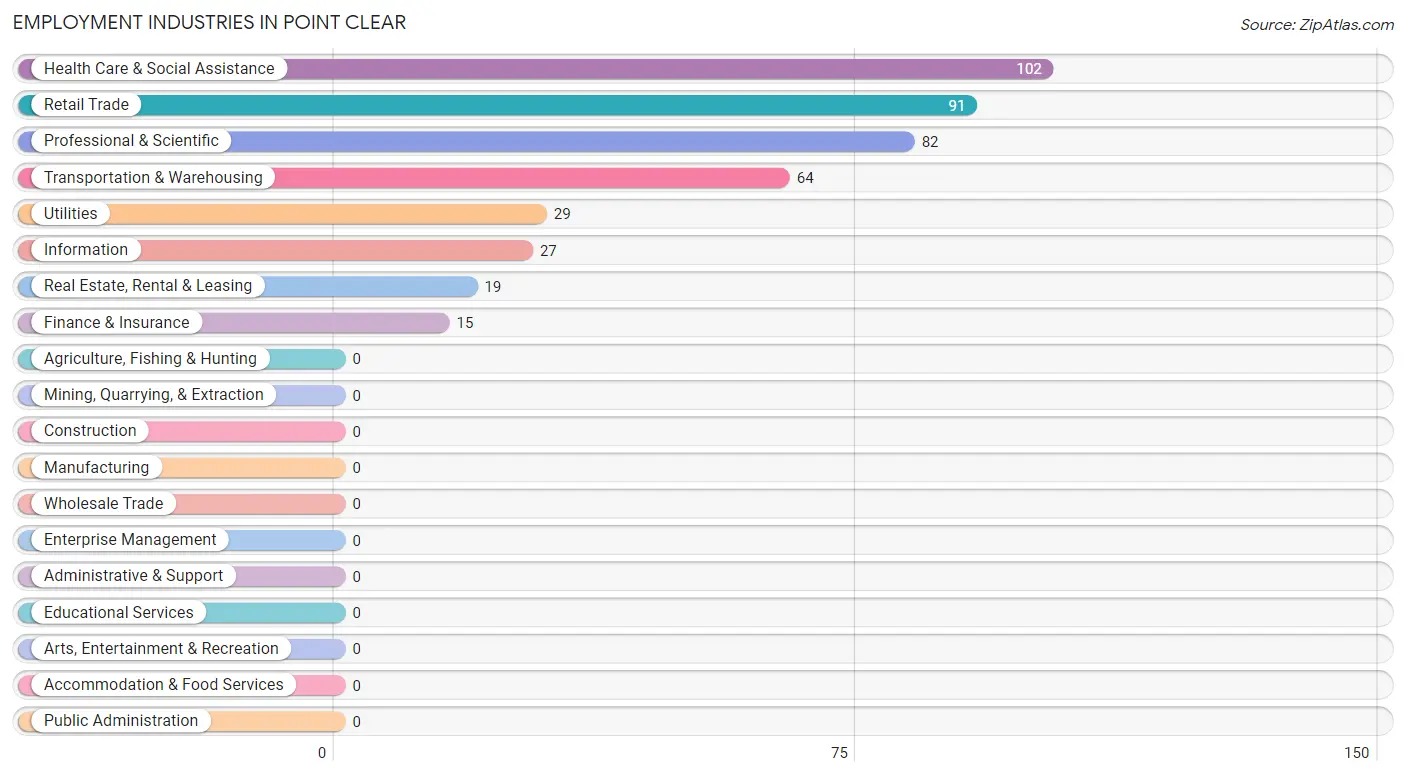
The major employment industries in Point Clear include Health Care & Social Assistance (102 | 23.8%), Retail Trade (91 | 21.2%), Professional & Scientific (82 | 19.1%), Transportation & Warehousing (64 | 14.9%), and Utilities (29 | 6.8%).
Employment Industries by Sex in Point Clear
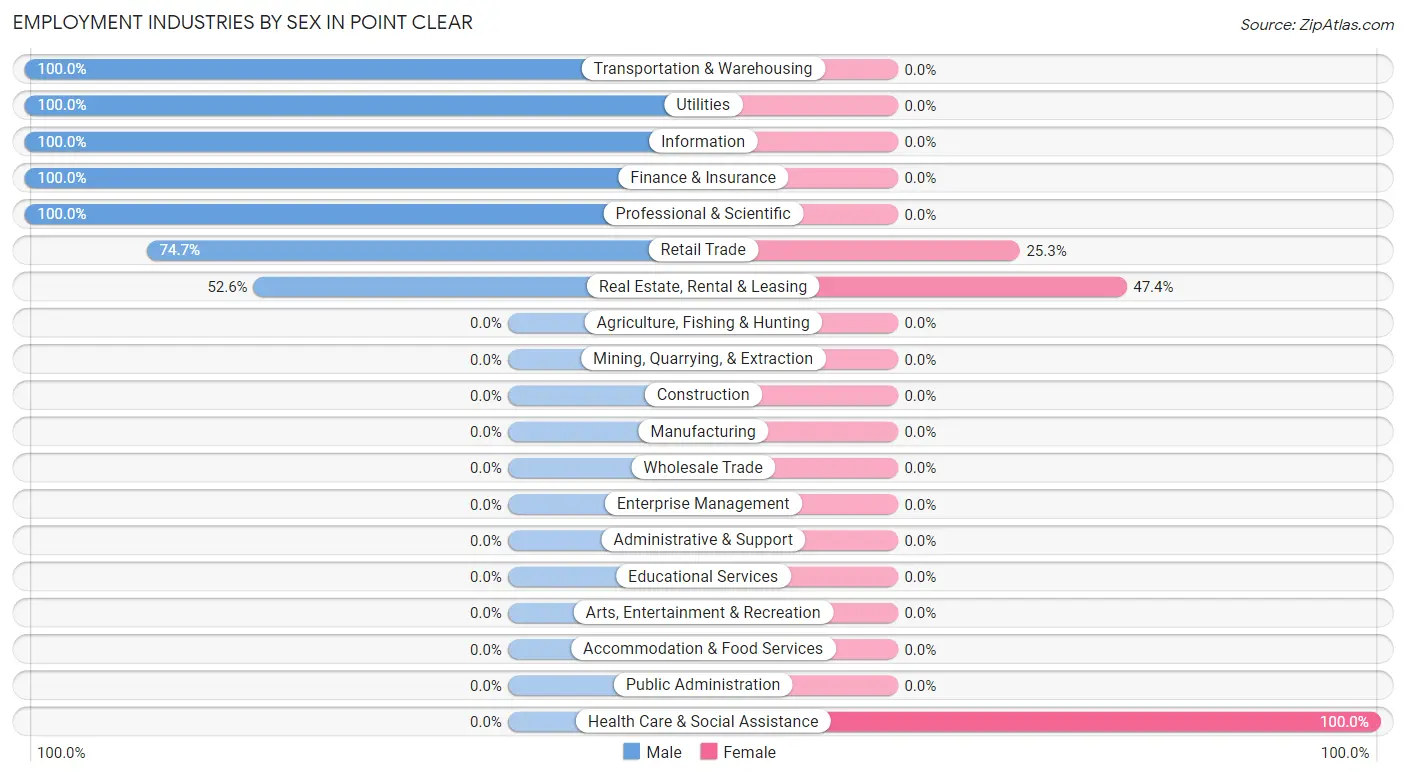
The Point Clear industries that see more men than women are Transportation & Warehousing (100.0%), Utilities (100.0%), and Information (100.0%), whereas the industries that tend to have a higher number of women are Health Care & Social Assistance (100.0%), Real Estate, Rental & Leasing (47.4%), and Retail Trade (25.3%).
| Industry | Male | Female |
| Agriculture, Fishing & Hunting | 0 (0.0%) | 0 (0.0%) |
| Mining, Quarrying, & Extraction | 0 (0.0%) | 0 (0.0%) |
| Construction | 0 (0.0%) | 0 (0.0%) |
| Manufacturing | 0 (0.0%) | 0 (0.0%) |
| Wholesale Trade | 0 (0.0%) | 0 (0.0%) |
| Retail Trade | 68 (74.7%) | 23 (25.3%) |
| Transportation & Warehousing | 64 (100.0%) | 0 (0.0%) |
| Utilities | 29 (100.0%) | 0 (0.0%) |
| Information | 27 (100.0%) | 0 (0.0%) |
| Finance & Insurance | 15 (100.0%) | 0 (0.0%) |
| Real Estate, Rental & Leasing | 10 (52.6%) | 9 (47.4%) |
| Professional & Scientific | 82 (100.0%) | 0 (0.0%) |
| Enterprise Management | 0 (0.0%) | 0 (0.0%) |
| Administrative & Support | 0 (0.0%) | 0 (0.0%) |
| Educational Services | 0 (0.0%) | 0 (0.0%) |
| Health Care & Social Assistance | 0 (0.0%) | 102 (100.0%) |
| Arts, Entertainment & Recreation | 0 (0.0%) | 0 (0.0%) |
| Accommodation & Food Services | 0 (0.0%) | 0 (0.0%) |
| Public Administration | 0 (0.0%) | 0 (0.0%) |
| Total | 295 (68.8%) | 134 (31.2%) |
Education in Point Clear
School Enrollment in Point Clear
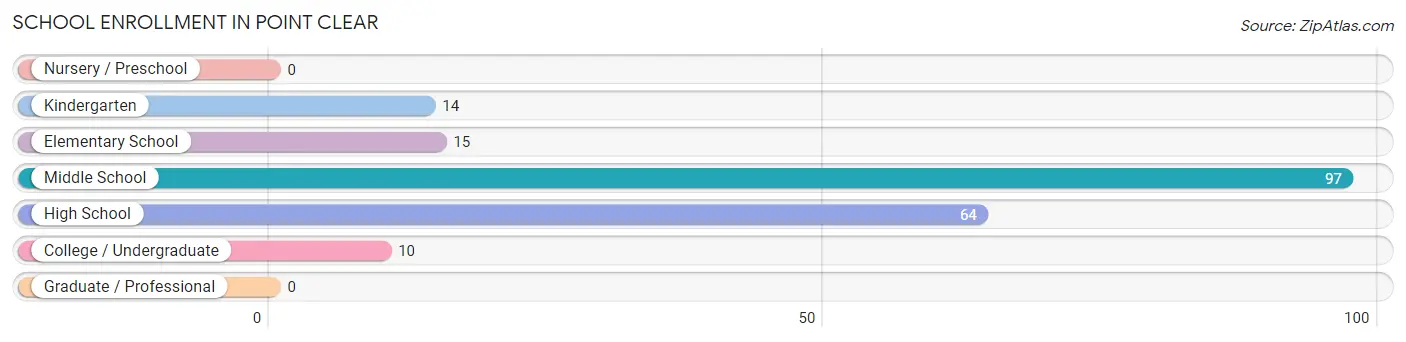
The most common levels of schooling among the 200 students in Point Clear are middle school (97 | 48.5%), high school (64 | 32.0%), and elementary school (15 | 7.5%).
| School Level | # Students | % Students |
| Nursery / Preschool | 0 | 0.0% |
| Kindergarten | 14 | 7.0% |
| Elementary School | 15 | 7.5% |
| Middle School | 97 | 48.5% |
| High School | 64 | 32.0% |
| College / Undergraduate | 10 | 5.0% |
| Graduate / Professional | 0 | 0.0% |
| Total | 200 | 100.0% |
School Enrollment by Age by Funding Source in Point Clear
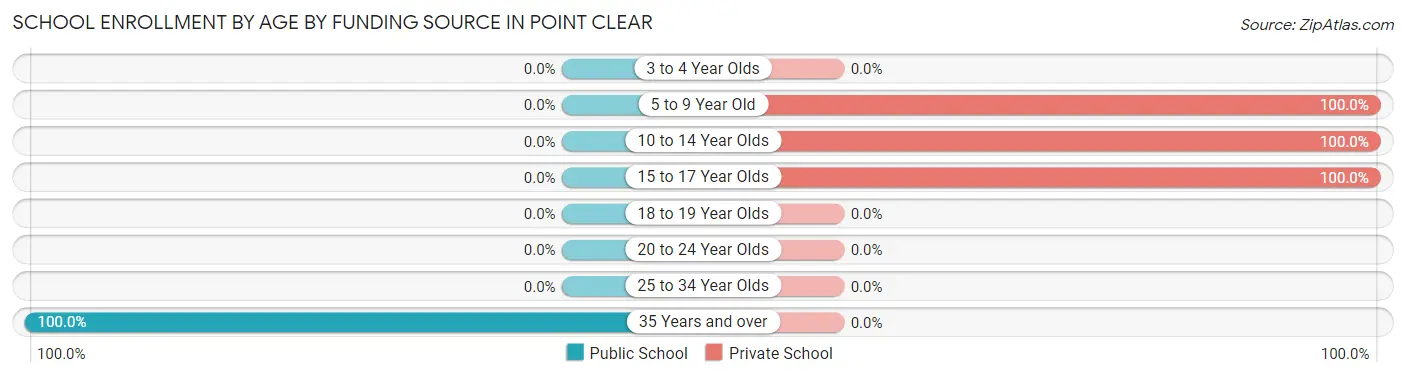
Out of a total of 200 students who are enrolled in schools in Point Clear, 190 (95.0%) attend a private institution, while the remaining 10 (5.0%) are enrolled in public schools. The age group of 5 to 9 year old has the highest likelihood of being enrolled in private schools, with 29 (100.0% in the age bracket) enrolled. Conversely, the age group of 35 years and over has the lowest likelihood of being enrolled in a private school, with 10 (100.0% in the age bracket) attending a public institution.
| Age Bracket | Public School | Private School |
| 3 to 4 Year Olds | 0 (0.0%) | 0 (0.0%) |
| 5 to 9 Year Old | 0 (0.0%) | 29 (100.0%) |
| 10 to 14 Year Olds | 0 (0.0%) | 105 (100.0%) |
| 15 to 17 Year Olds | 0 (0.0%) | 56 (100.0%) |
| 18 to 19 Year Olds | 0 (0.0%) | 0 (0.0%) |
| 20 to 24 Year Olds | 0 (0.0%) | 0 (0.0%) |
| 25 to 34 Year Olds | 0 (0.0%) | 0 (0.0%) |
| 35 Years and over | 10 (100.0%) | 0 (0.0%) |
| Total | 10 (5.0%) | 190 (95.0%) |
Educational Attainment by Field of Study in Point Clear
Business (192 | 21.7%), liberal arts & history (136 | 15.4%), social sciences (128 | 14.5%), bio, nature & agricultural (111 | 12.5%), and science & technology (75 | 8.5%) are the most common fields of study among 885 individuals in Point Clear who have obtained a bachelor's degree or higher.
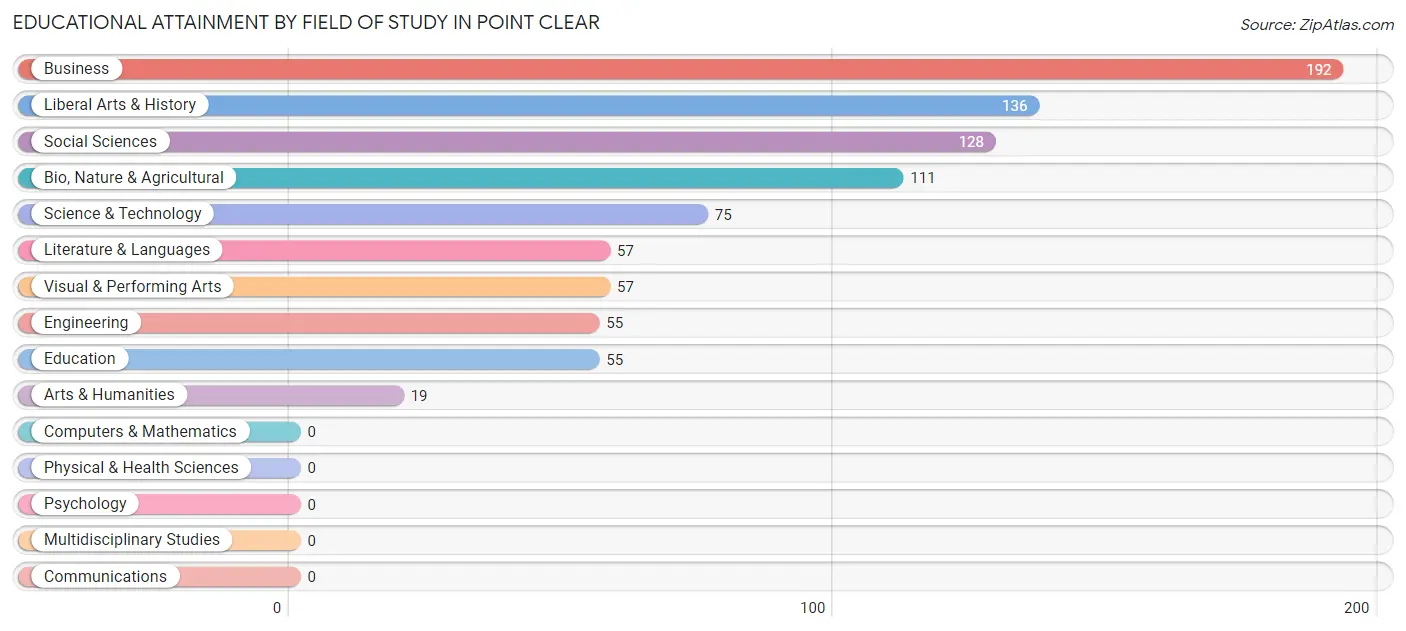
| Field of Study | # Graduates | % Graduates |
| Computers & Mathematics | 0 | 0.0% |
| Bio, Nature & Agricultural | 111 | 12.5% |
| Physical & Health Sciences | 0 | 0.0% |
| Psychology | 0 | 0.0% |
| Social Sciences | 128 | 14.5% |
| Engineering | 55 | 6.2% |
| Multidisciplinary Studies | 0 | 0.0% |
| Science & Technology | 75 | 8.5% |
| Business | 192 | 21.7% |
| Education | 55 | 6.2% |
| Literature & Languages | 57 | 6.4% |
| Liberal Arts & History | 136 | 15.4% |
| Visual & Performing Arts | 57 | 6.4% |
| Communications | 0 | 0.0% |
| Arts & Humanities | 19 | 2.1% |
| Total | 885 | 100.0% |
Transportation & Commute in Point Clear
Vehicle Availability by Sex in Point Clear
The most prevalent vehicle ownership categories in Point Clear are males with 4 vehicles (97, accounting for 36.2%) and females with 4 vehicles (34, making up 72.4%).
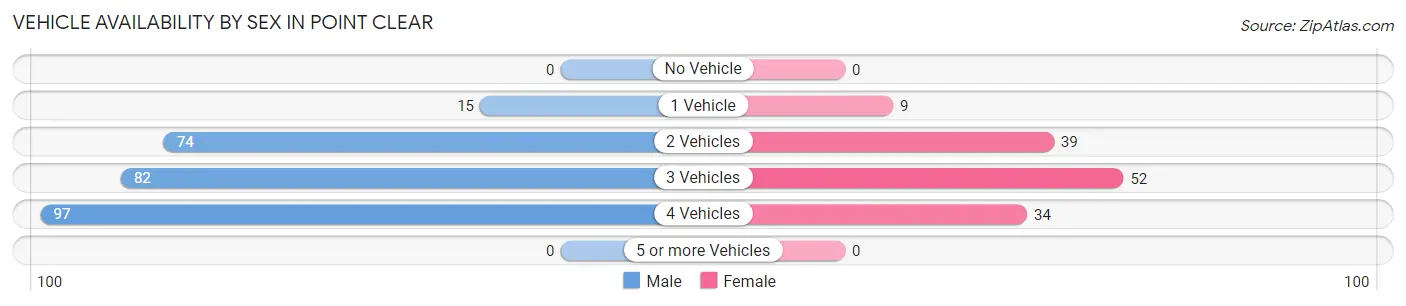
| Vehicles Available | Male | Female |
| No Vehicle | 0 (0.0%) | 0 (0.0%) |
| 1 Vehicle | 15 (5.6%) | 9 (6.7%) |
| 2 Vehicles | 74 (27.6%) | 39 (29.1%) |
| 3 Vehicles | 82 (30.6%) | 52 (38.8%) |
| 4 Vehicles | 97 (36.2%) | 34 (25.4%) |
| 5 or more Vehicles | 0 (0.0%) | 0 (0.0%) |
| Total | 268 (100.0%) | 134 (100.0%) |
Commute Time in Point Clear
The most frequently occuring commute durations in Point Clear are 10 to 14 minutes (78 commuters, 21.8%), 5 to 9 minutes (68 commuters, 19.1%), and less than 5 minutes (64 commuters, 17.9%).
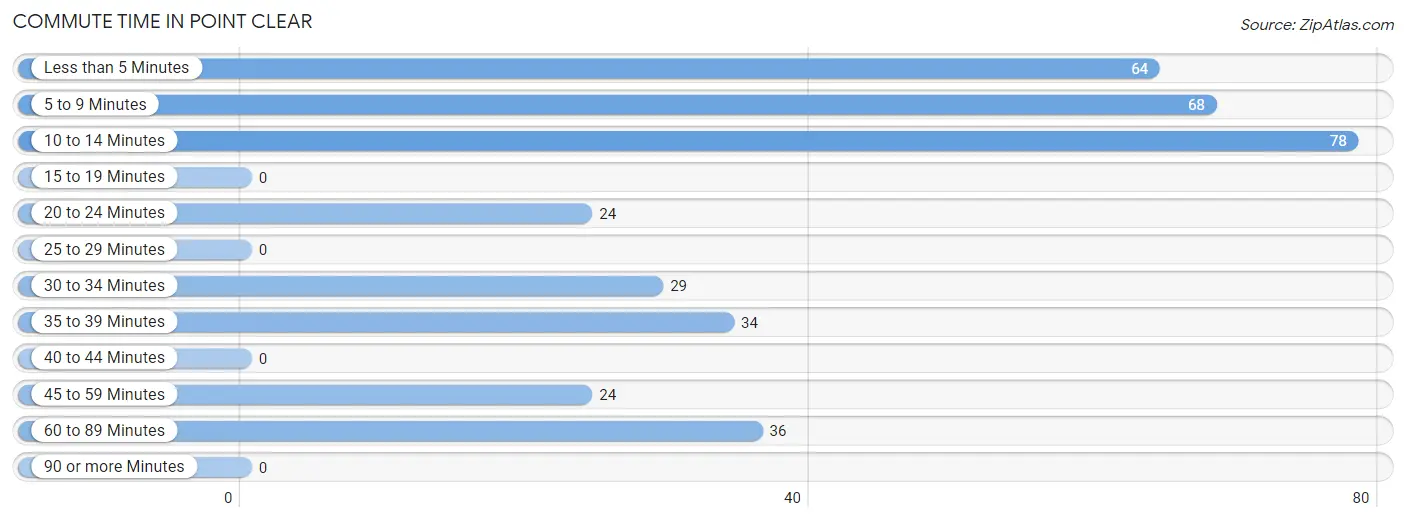
| Commute Time | # Commuters | % Commuters |
| Less than 5 Minutes | 64 | 17.9% |
| 5 to 9 Minutes | 68 | 19.1% |
| 10 to 14 Minutes | 78 | 21.8% |
| 15 to 19 Minutes | 0 | 0.0% |
| 20 to 24 Minutes | 24 | 6.7% |
| 25 to 29 Minutes | 0 | 0.0% |
| 30 to 34 Minutes | 29 | 8.1% |
| 35 to 39 Minutes | 34 | 9.5% |
| 40 to 44 Minutes | 0 | 0.0% |
| 45 to 59 Minutes | 24 | 6.7% |
| 60 to 89 Minutes | 36 | 10.1% |
| 90 or more Minutes | 0 | 0.0% |
Commute Time by Sex in Point Clear
The most common commute times in Point Clear are 10 to 14 minutes (78 commuters, 31.7%) for males and 5 to 9 minutes (68 commuters, 61.3%) for females.
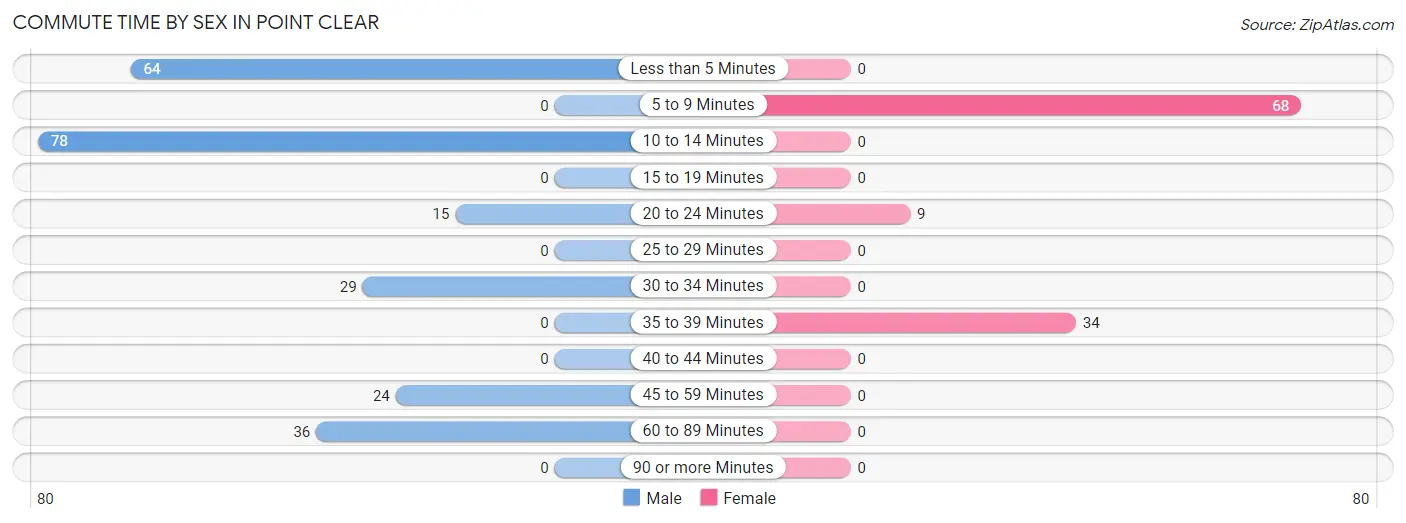
| Commute Time | Male | Female |
| Less than 5 Minutes | 64 (26.0%) | 0 (0.0%) |
| 5 to 9 Minutes | 0 (0.0%) | 68 (61.3%) |
| 10 to 14 Minutes | 78 (31.7%) | 0 (0.0%) |
| 15 to 19 Minutes | 0 (0.0%) | 0 (0.0%) |
| 20 to 24 Minutes | 15 (6.1%) | 9 (8.1%) |
| 25 to 29 Minutes | 0 (0.0%) | 0 (0.0%) |
| 30 to 34 Minutes | 29 (11.8%) | 0 (0.0%) |
| 35 to 39 Minutes | 0 (0.0%) | 34 (30.6%) |
| 40 to 44 Minutes | 0 (0.0%) | 0 (0.0%) |
| 45 to 59 Minutes | 24 (9.8%) | 0 (0.0%) |
| 60 to 89 Minutes | 36 (14.6%) | 0 (0.0%) |
| 90 or more Minutes | 0 (0.0%) | 0 (0.0%) |
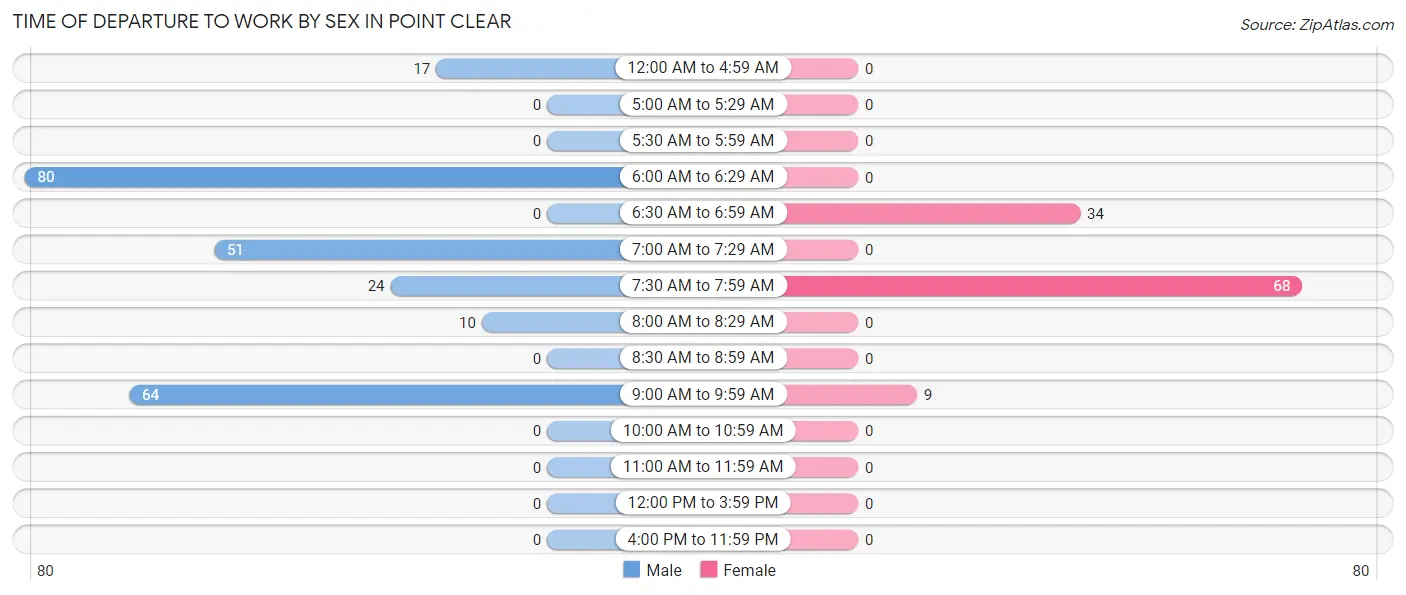
Time of Departure to Work by Sex in Point Clear
The most frequent times of departure to work in Point Clear are 6:00 AM to 6:29 AM (80, 32.5%) for males and 7:30 AM to 7:59 AM (68, 61.3%) for females.
| Time of Departure | Male | Female |
| 12:00 AM to 4:59 AM | 17 (6.9%) | 0 (0.0%) |
| 5:00 AM to 5:29 AM | 0 (0.0%) | 0 (0.0%) |
| 5:30 AM to 5:59 AM | 0 (0.0%) | 0 (0.0%) |
| 6:00 AM to 6:29 AM | 80 (32.5%) | 0 (0.0%) |
| 6:30 AM to 6:59 AM | 0 (0.0%) | 34 (30.6%) |
| 7:00 AM to 7:29 AM | 51 (20.7%) | 0 (0.0%) |
| 7:30 AM to 7:59 AM | 24 (9.8%) | 68 (61.3%) |
| 8:00 AM to 8:29 AM | 10 (4.1%) | 0 (0.0%) |
| 8:30 AM to 8:59 AM | 0 (0.0%) | 0 (0.0%) |
| 9:00 AM to 9:59 AM | 64 (26.0%) | 9 (8.1%) |
| 10:00 AM to 10:59 AM | 0 (0.0%) | 0 (0.0%) |
| 11:00 AM to 11:59 AM | 0 (0.0%) | 0 (0.0%) |
| 12:00 PM to 3:59 PM | 0 (0.0%) | 0 (0.0%) |
| 4:00 PM to 11:59 PM | 0 (0.0%) | 0 (0.0%) |
| Total | 246 (100.0%) | 111 (100.0%) |
Housing Occupancy in Point Clear
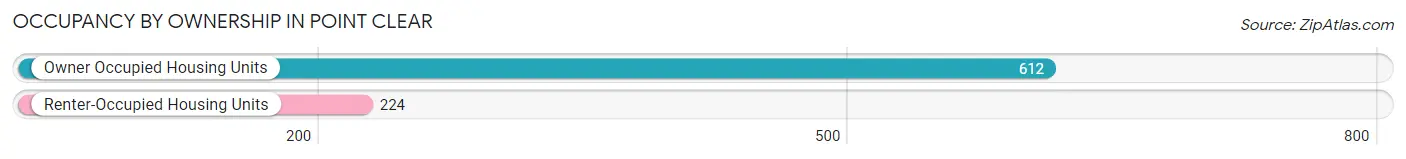
Occupancy by Ownership in Point Clear
Of the total 836 dwellings in Point Clear, owner-occupied units account for 612 (73.2%), while renter-occupied units make up 224 (26.8%).
| Occupancy | # Housing Units | % Housing Units |
| Owner Occupied Housing Units | 612 | 73.2% |
| Renter-Occupied Housing Units | 224 | 26.8% |
| Total Occupied Housing Units | 836 | 100.0% |
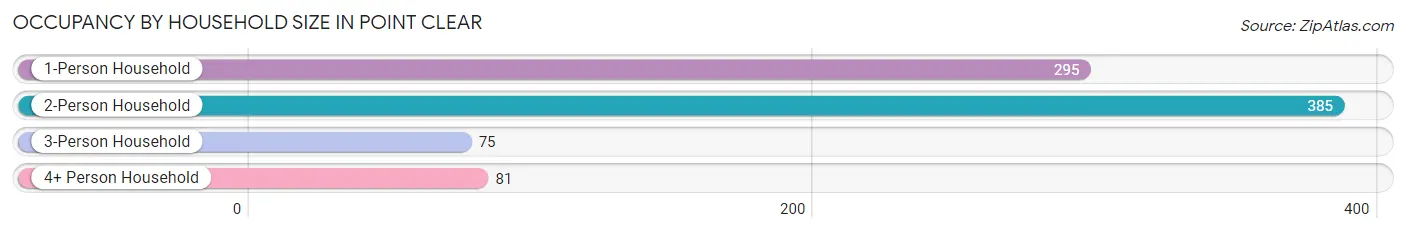
Occupancy by Household Size in Point Clear
| Household Size | # Housing Units | % Housing Units |
| 1-Person Household | 295 | 35.3% |
| 2-Person Household | 385 | 46.1% |
| 3-Person Household | 75 | 9.0% |
| 4+ Person Household | 81 | 9.7% |
| Total Housing Units | 836 | 100.0% |
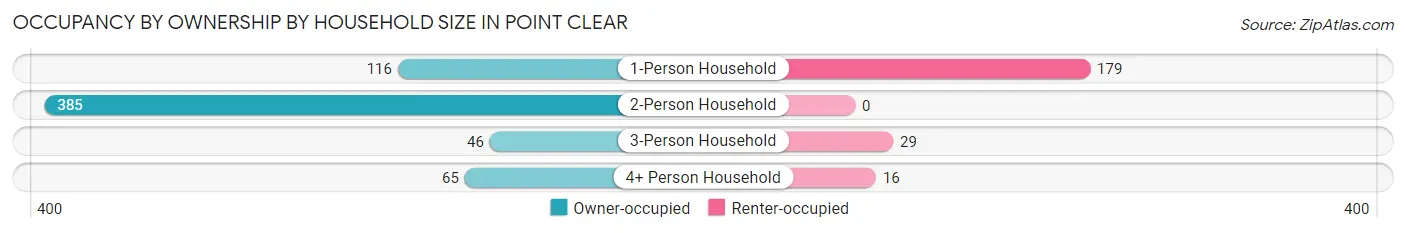
Occupancy by Ownership by Household Size in Point Clear
| Household Size | Owner-occupied | Renter-occupied |
| 1-Person Household | 116 (39.3%) | 179 (60.7%) |
| 2-Person Household | 385 (100.0%) | 0 (0.0%) |
| 3-Person Household | 46 (61.3%) | 29 (38.7%) |
| 4+ Person Household | 65 (80.2%) | 16 (19.8%) |
| Total Housing Units | 612 (73.2%) | 224 (26.8%) |
Occupancy by Educational Attainment in Point Clear
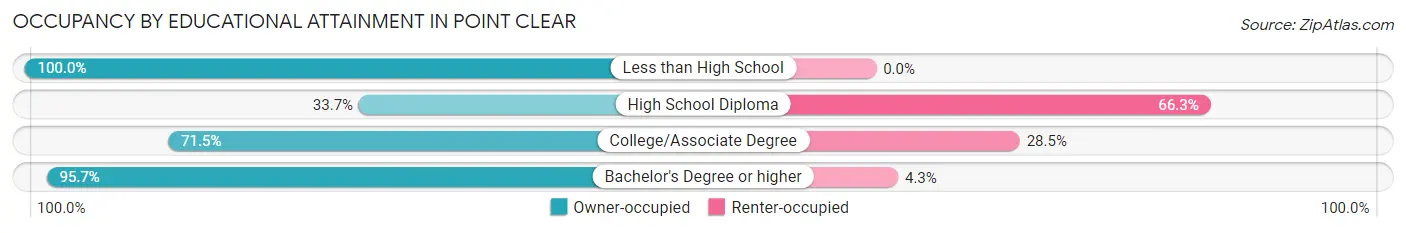
| Household Size | Owner-occupied | Renter-occupied |
| Less than High School | 79 (100.0%) | 0 (0.0%) |
| High School Diploma | 87 (33.7%) | 171 (66.3%) |
| College/Associate Degree | 93 (71.5%) | 37 (28.5%) |
| Bachelor's Degree or higher | 353 (95.7%) | 16 (4.3%) |
Occupancy by Age of Householder in Point Clear
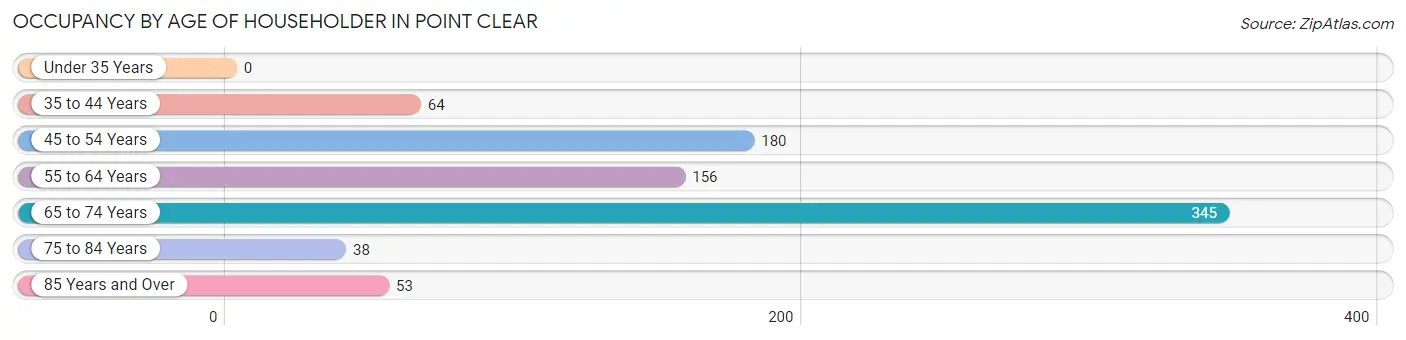
| Age Bracket | # Households | % Households |
| Under 35 Years | 0 | 0.0% |
| 35 to 44 Years | 64 | 7.7% |
| 45 to 54 Years | 180 | 21.5% |
| 55 to 64 Years | 156 | 18.7% |
| 65 to 74 Years | 345 | 41.3% |
| 75 to 84 Years | 38 | 4.5% |
| 85 Years and Over | 53 | 6.3% |
| Total | 836 | 100.0% |
Housing Finances in Point Clear
Median Income by Occupancy in Point Clear
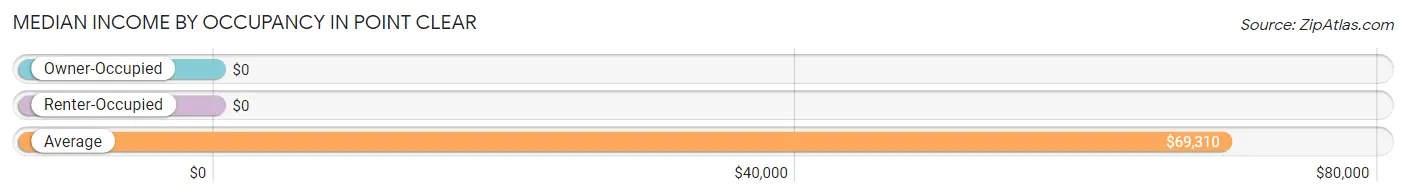
| Occupancy Type | # Households | Median Income |
| Owner-Occupied | 612 (73.2%) | $0 |
| Renter-Occupied | 224 (26.8%) | $0 |
| Average | 836 (100.0%) | $69,310 |
Occupancy by Householder Income Bracket in Point Clear
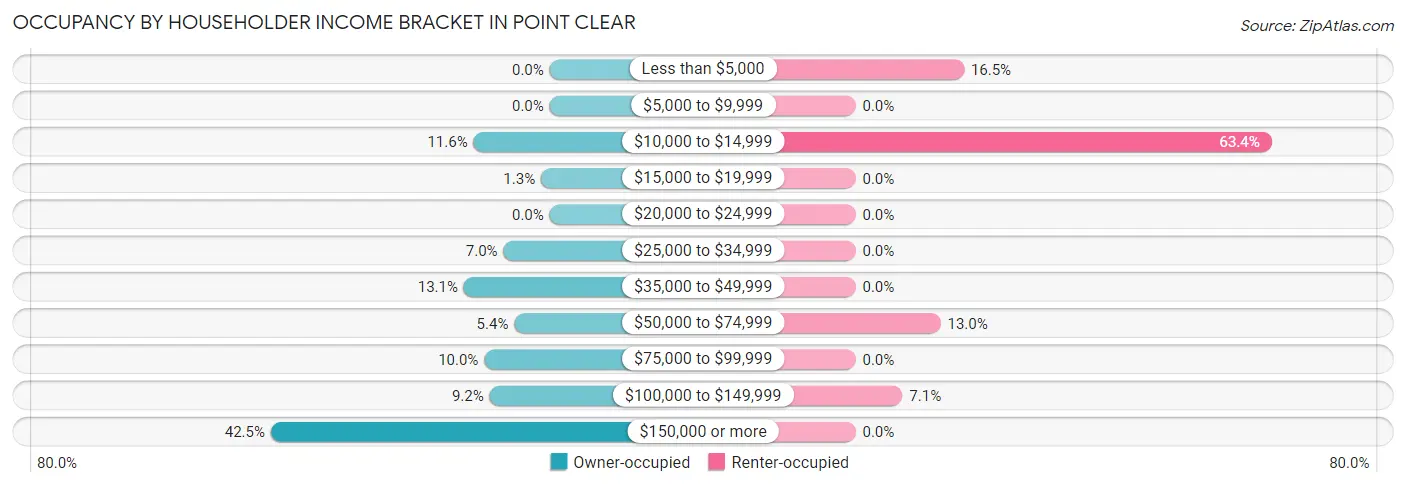
| Income Bracket | Owner-occupied | Renter-occupied |
| Less than $5,000 | 0 (0.0%) | 37 (16.5%) |
| $5,000 to $9,999 | 0 (0.0%) | 0 (0.0%) |
| $10,000 to $14,999 | 71 (11.6%) | 142 (63.4%) |
| $15,000 to $19,999 | 8 (1.3%) | 0 (0.0%) |
| $20,000 to $24,999 | 0 (0.0%) | 0 (0.0%) |
| $25,000 to $34,999 | 43 (7.0%) | 0 (0.0%) |
| $35,000 to $49,999 | 80 (13.1%) | 0 (0.0%) |
| $50,000 to $74,999 | 33 (5.4%) | 29 (13.0%) |
| $75,000 to $99,999 | 61 (10.0%) | 0 (0.0%) |
| $100,000 to $149,999 | 56 (9.1%) | 16 (7.1%) |
| $150,000 or more | 260 (42.5%) | 0 (0.0%) |
| Total | 612 (100.0%) | 224 (100.0%) |
Monthly Housing Cost Tiers in Point Clear
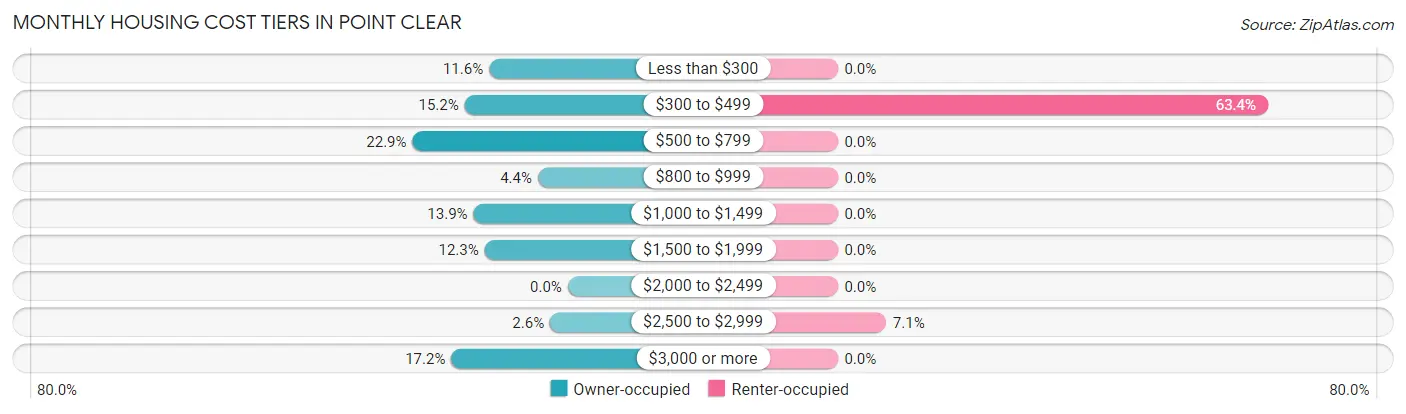
| Monthly Cost | Owner-occupied | Renter-occupied |
| Less than $300 | 71 (11.6%) | 0 (0.0%) |
| $300 to $499 | 93 (15.2%) | 142 (63.4%) |
| $500 to $799 | 140 (22.9%) | 0 (0.0%) |
| $800 to $999 | 27 (4.4%) | 0 (0.0%) |
| $1,000 to $1,499 | 85 (13.9%) | 0 (0.0%) |
| $1,500 to $1,999 | 75 (12.2%) | 0 (0.0%) |
| $2,000 to $2,499 | 0 (0.0%) | 0 (0.0%) |
| $2,500 to $2,999 | 16 (2.6%) | 16 (7.1%) |
| $3,000 or more | 105 (17.2%) | 0 (0.0%) |
| Total | 612 (100.0%) | 224 (100.0%) |
Physical Housing Characteristics in Point Clear
Housing Structures in Point Clear
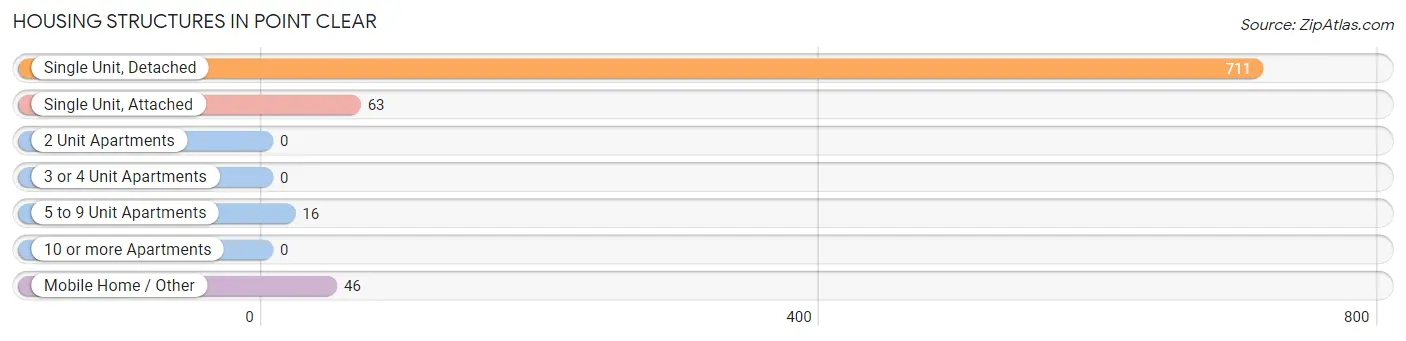
| Structure Type | # Housing Units | % Housing Units |
| Single Unit, Detached | 711 | 85.1% |
| Single Unit, Attached | 63 | 7.5% |
| 2 Unit Apartments | 0 | 0.0% |
| 3 or 4 Unit Apartments | 0 | 0.0% |
| 5 to 9 Unit Apartments | 16 | 1.9% |
| 10 or more Apartments | 0 | 0.0% |
| Mobile Home / Other | 46 | 5.5% |
| Total | 836 | 100.0% |
Housing Structures by Occupancy in Point Clear
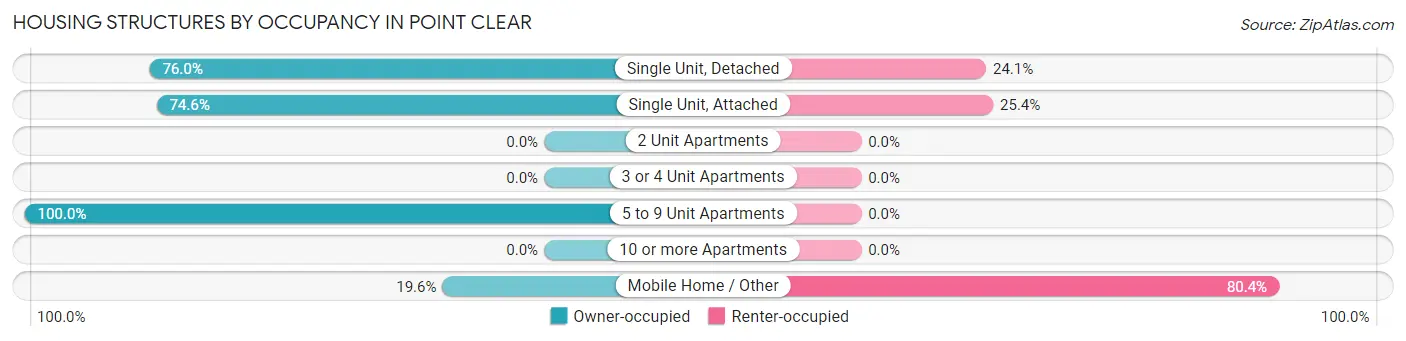
| Structure Type | Owner-occupied | Renter-occupied |
| Single Unit, Detached | 540 (75.9%) | 171 (24.0%) |
| Single Unit, Attached | 47 (74.6%) | 16 (25.4%) |
| 2 Unit Apartments | 0 (0.0%) | 0 (0.0%) |
| 3 or 4 Unit Apartments | 0 (0.0%) | 0 (0.0%) |
| 5 to 9 Unit Apartments | 16 (100.0%) | 0 (0.0%) |
| 10 or more Apartments | 0 (0.0%) | 0 (0.0%) |
| Mobile Home / Other | 9 (19.6%) | 37 (80.4%) |
| Total | 612 (73.2%) | 224 (26.8%) |
Housing Structures by Number of Rooms in Point Clear
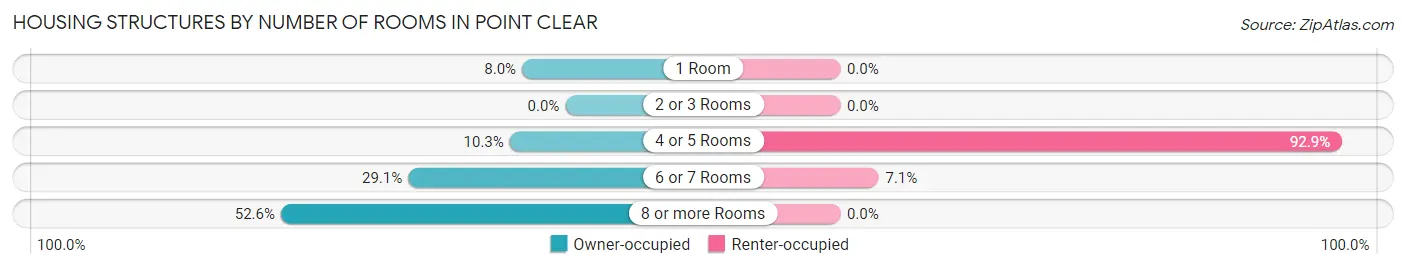
| Number of Rooms | Owner-occupied | Renter-occupied |
| 1 Room | 49 (8.0%) | 0 (0.0%) |
| 2 or 3 Rooms | 0 (0.0%) | 0 (0.0%) |
| 4 or 5 Rooms | 63 (10.3%) | 208 (92.9%) |
| 6 or 7 Rooms | 178 (29.1%) | 16 (7.1%) |
| 8 or more Rooms | 322 (52.6%) | 0 (0.0%) |
| Total | 612 (100.0%) | 224 (100.0%) |
Housing Structure by Heating Type in Point Clear
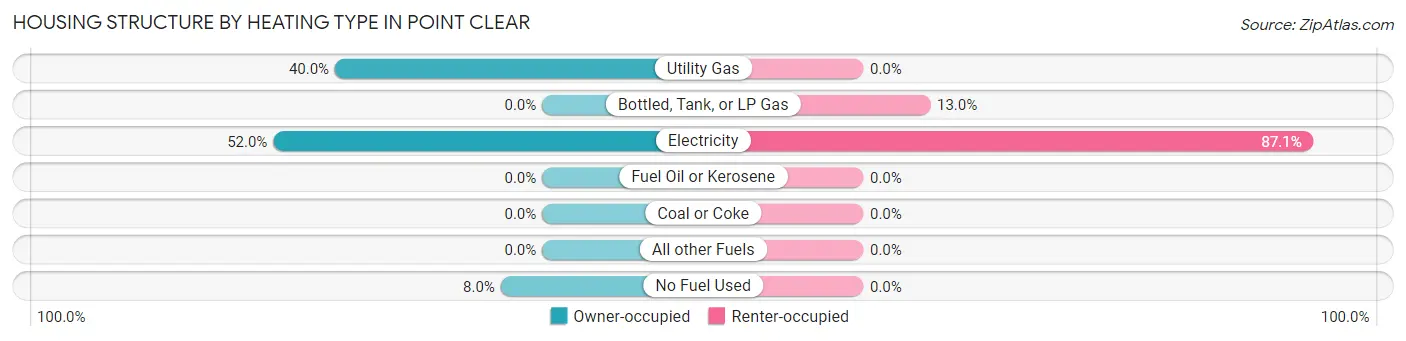
| Heating Type | Owner-occupied | Renter-occupied |
| Utility Gas | 245 (40.0%) | 0 (0.0%) |
| Bottled, Tank, or LP Gas | 0 (0.0%) | 29 (13.0%) |
| Electricity | 318 (52.0%) | 195 (87.1%) |
| Fuel Oil or Kerosene | 0 (0.0%) | 0 (0.0%) |
| Coal or Coke | 0 (0.0%) | 0 (0.0%) |
| All other Fuels | 0 (0.0%) | 0 (0.0%) |
| No Fuel Used | 49 (8.0%) | 0 (0.0%) |
| Total | 612 (100.0%) | 224 (100.0%) |
Household Vehicle Usage in Point Clear
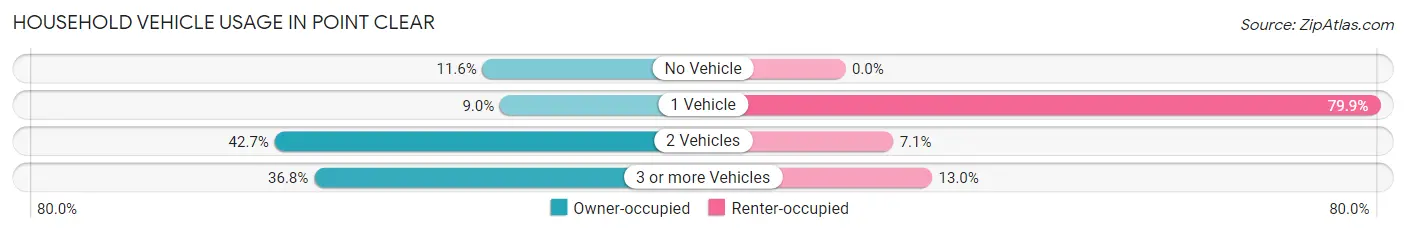
| Vehicles per Household | Owner-occupied | Renter-occupied |
| No Vehicle | 71 (11.6%) | 0 (0.0%) |
| 1 Vehicle | 55 (9.0%) | 179 (79.9%) |
| 2 Vehicles | 261 (42.6%) | 16 (7.1%) |
| 3 or more Vehicles | 225 (36.8%) | 29 (13.0%) |
| Total | 612 (100.0%) | 224 (100.0%) |
Real Estate & Mortgages in Point Clear
Real Estate and Mortgage Overview in Point Clear
| Characteristic | Without Mortgage | With Mortgage |
| Housing Units | 427 | 185 |
| Median Property Value | $949,800 | $1,032,400 |
| Median Household Income | $94,550 | $107 |
| Monthly Housing Costs | $672 | $105 |
| Real Estate Taxes | $1,673 | $9 |
Property Value by Mortgage Status in Point Clear
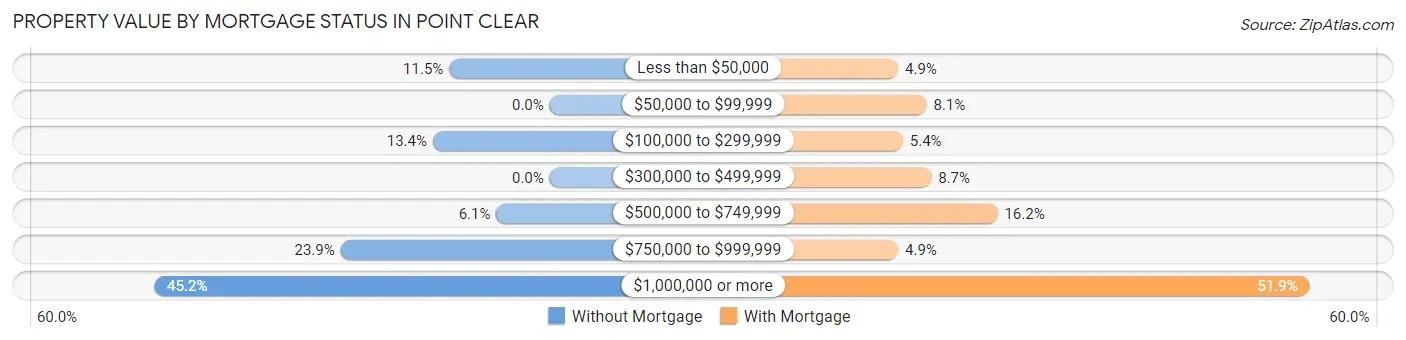
| Property Value | Without Mortgage | With Mortgage |
| Less than $50,000 | 49 (11.5%) | 9 (4.9%) |
| $50,000 to $99,999 | 0 (0.0%) | 15 (8.1%) |
| $100,000 to $299,999 | 57 (13.4%) | 10 (5.4%) |
| $300,000 to $499,999 | 0 (0.0%) | 16 (8.6%) |
| $500,000 to $749,999 | 26 (6.1%) | 30 (16.2%) |
| $750,000 to $999,999 | 102 (23.9%) | 9 (4.9%) |
| $1,000,000 or more | 193 (45.2%) | 96 (51.9%) |
| Total | 427 (100.0%) | 185 (100.0%) |
Household Income by Mortgage Status in Point Clear
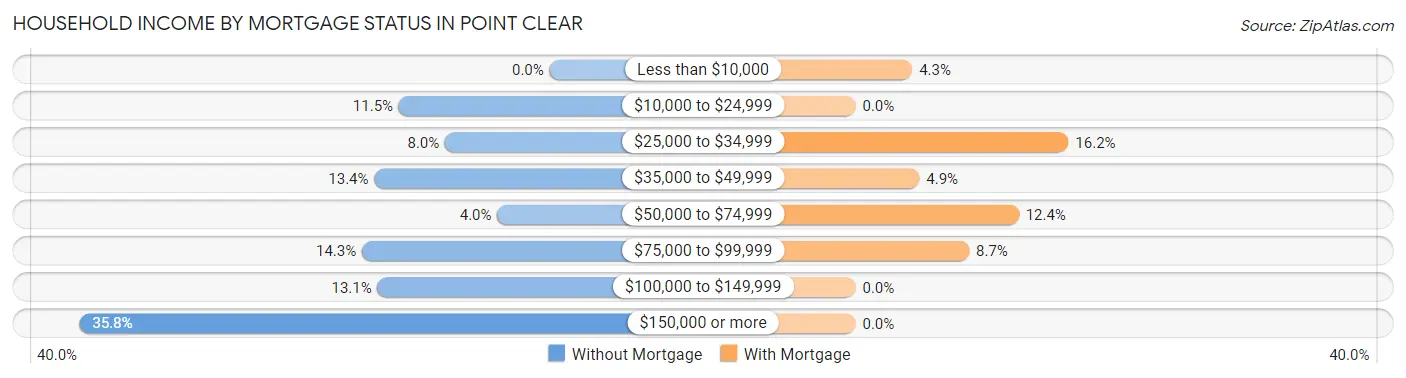
| Household Income | Without Mortgage | With Mortgage |
| Less than $10,000 | 0 (0.0%) | 8 (4.3%) |
| $10,000 to $24,999 | 49 (11.5%) | 0 (0.0%) |
| $25,000 to $34,999 | 34 (8.0%) | 30 (16.2%) |
| $35,000 to $49,999 | 57 (13.4%) | 9 (4.9%) |
| $50,000 to $74,999 | 17 (4.0%) | 23 (12.4%) |
| $75,000 to $99,999 | 61 (14.3%) | 16 (8.6%) |
| $100,000 to $149,999 | 56 (13.1%) | 0 (0.0%) |
| $150,000 or more | 153 (35.8%) | 0 (0.0%) |
| Total | 427 (100.0%) | 185 (100.0%) |
Property Value to Household Income Ratio in Point Clear
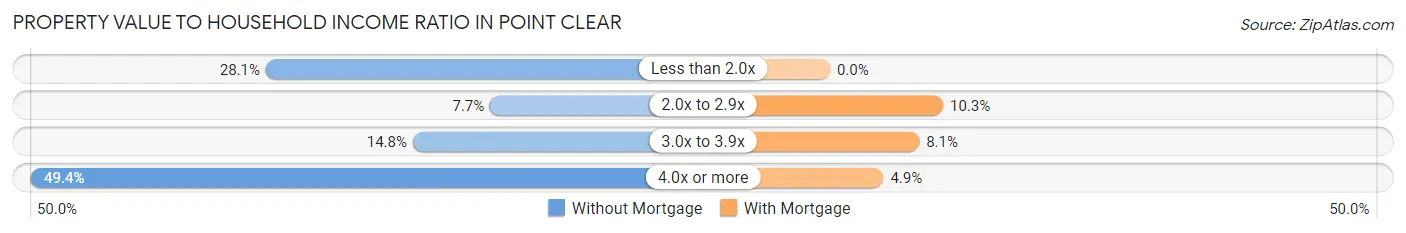
| Value-to-Income Ratio | Without Mortgage | With Mortgage |
| Less than 2.0x | 120 (28.1%) | 0 (0.0%) |
| 2.0x to 2.9x | 33 (7.7%) | 19 (10.3%) |
| 3.0x to 3.9x | 63 (14.7%) | 15 (8.1%) |
| 4.0x or more | 211 (49.4%) | 9 (4.9%) |
| Total | 427 (100.0%) | 185 (100.0%) |
Real Estate Taxes by Mortgage Status in Point Clear
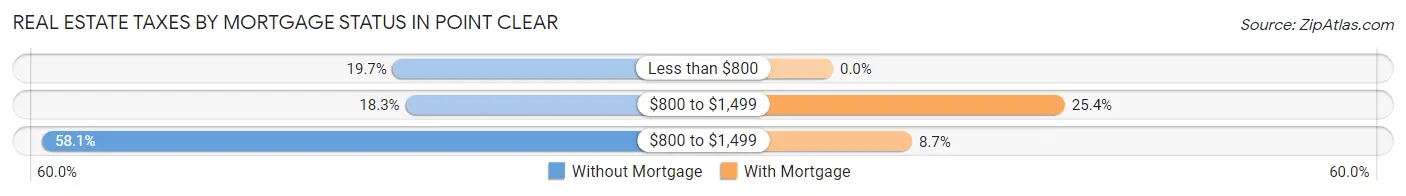
| Property Taxes | Without Mortgage | With Mortgage |
| Less than $800 | 84 (19.7%) | 0 (0.0%) |
| $800 to $1,499 | 78 (18.3%) | 47 (25.4%) |
| $800 to $1,499 | 248 (58.1%) | 16 (8.6%) |
| Total | 427 (100.0%) | 185 (100.0%) |
Health & Disability in Point Clear
Health Insurance Coverage by Age in Point Clear
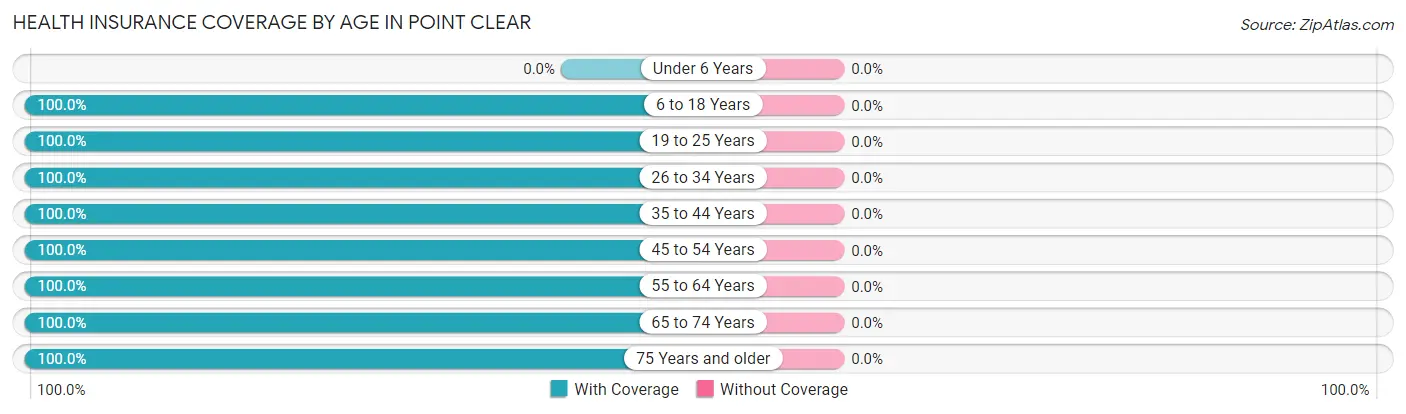
| Age Bracket | With Coverage | Without Coverage |
| Under 6 Years | 0 (0.0%) | 0 (0.0%) |
| 6 to 18 Years | 190 (100.0%) | 0 (0.0%) |
| 19 to 25 Years | 68 (100.0%) | 0 (0.0%) |
| 26 to 34 Years | 34 (100.0%) | 0 (0.0%) |
| 35 to 44 Years | 121 (100.0%) | 0 (0.0%) |
| 45 to 54 Years | 247 (100.0%) | 0 (0.0%) |
| 55 to 64 Years | 250 (100.0%) | 0 (0.0%) |
| 65 to 74 Years | 623 (100.0%) | 0 (0.0%) |
| 75 Years and older | 222 (100.0%) | 0 (0.0%) |
| Total | 1,755 (100.0%) | 0 (0.0%) |
Health Insurance Coverage by Citizenship Status in Point Clear
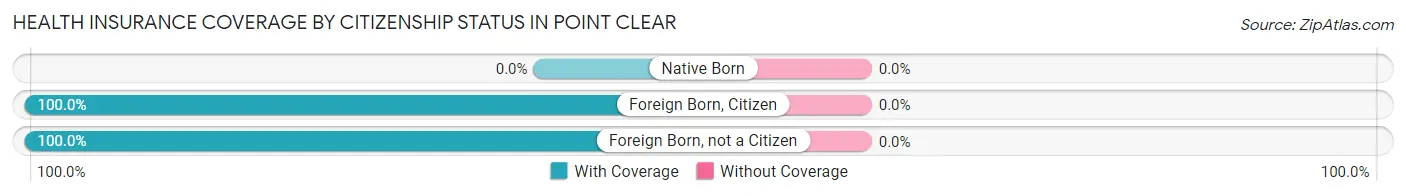
| Citizenship Status | With Coverage | Without Coverage |
| Native Born | 0 (0.0%) | 0 (0.0%) |
| Foreign Born, Citizen | 190 (100.0%) | 0 (0.0%) |
| Foreign Born, not a Citizen | 68 (100.0%) | 0 (0.0%) |
Health Insurance Coverage by Household Income in Point Clear
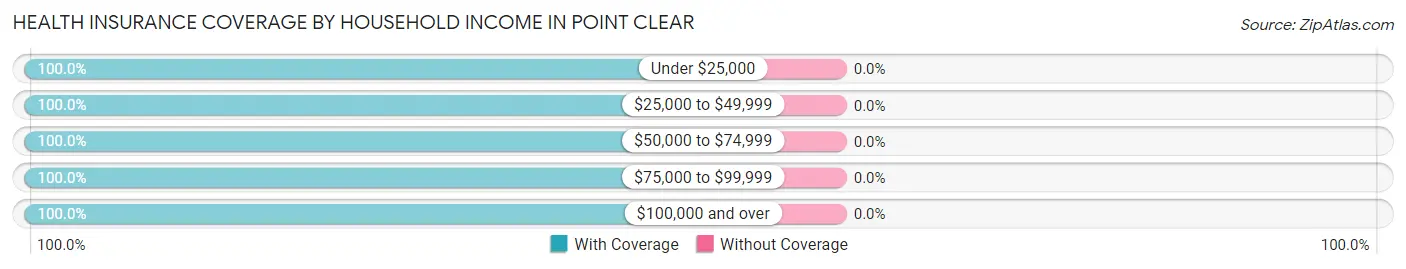
| Household Income | With Coverage | Without Coverage |
| Under $25,000 | 316 (100.0%) | 0 (0.0%) |
| $25,000 to $49,999 | 191 (100.0%) | 0 (0.0%) |
| $50,000 to $74,999 | 131 (100.0%) | 0 (0.0%) |
| $75,000 to $99,999 | 187 (100.0%) | 0 (0.0%) |
| $100,000 and over | 930 (100.0%) | 0 (0.0%) |
Public vs Private Health Insurance Coverage by Age in Point Clear
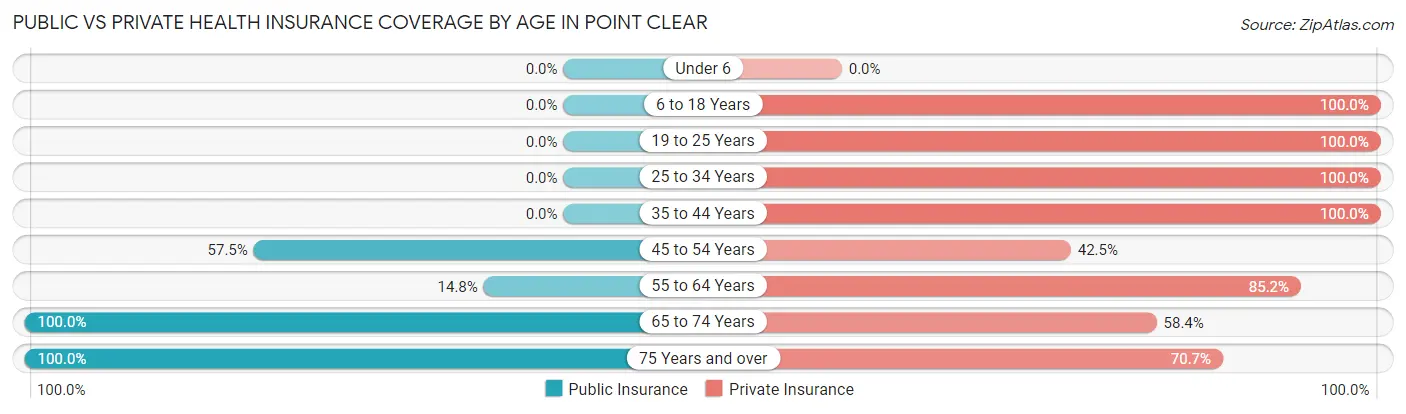
| Age Bracket | Public Insurance | Private Insurance |
| Under 6 | 0 (0.0%) | 0 (0.0%) |
| 6 to 18 Years | 0 (0.0%) | 190 (100.0%) |
| 19 to 25 Years | 0 (0.0%) | 68 (100.0%) |
| 25 to 34 Years | 0 (0.0%) | 34 (100.0%) |
| 35 to 44 Years | 0 (0.0%) | 121 (100.0%) |
| 45 to 54 Years | 142 (57.5%) | 105 (42.5%) |
| 55 to 64 Years | 37 (14.8%) | 213 (85.2%) |
| 65 to 74 Years | 623 (100.0%) | 364 (58.4%) |
| 75 Years and over | 222 (100.0%) | 157 (70.7%) |
| Total | 1,024 (58.4%) | 1,252 (71.3%) |
Disability Status by Sex by Age in Point Clear
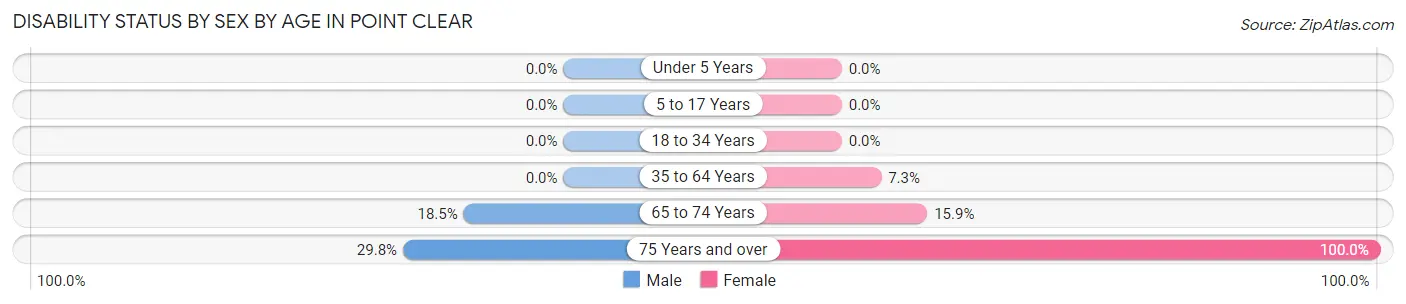
| Age Bracket | Male | Female |
| Under 5 Years | 0 (0.0%) | 0 (0.0%) |
| 5 to 17 Years | 0 (0.0%) | 0 (0.0%) |
| 18 to 34 Years | 0 (0.0%) | 0 (0.0%) |
| 35 to 64 Years | 0 (0.0%) | 18 (7.3%) |
| 65 to 74 Years | 50 (18.5%) | 56 (15.9%) |
| 75 Years and over | 53 (29.8%) | 44 (100.0%) |
Disability Class by Sex by Age in Point Clear
Disability Class: Hearing Difficulty
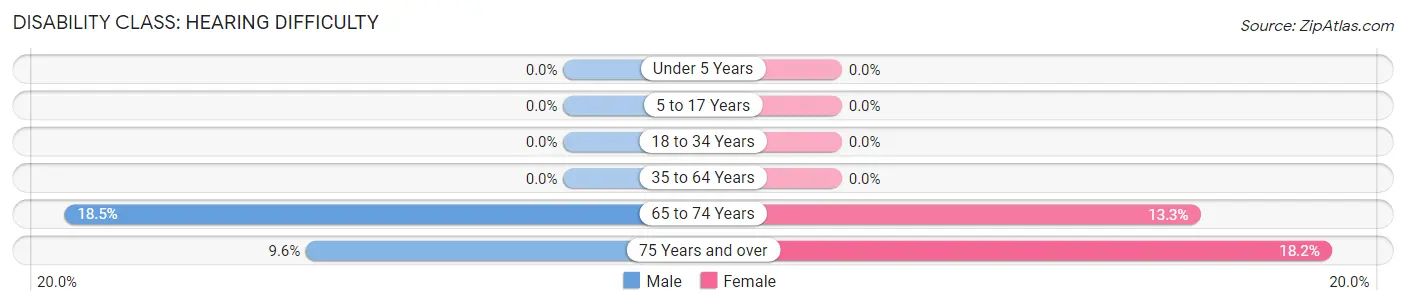
| Age Bracket | Male | Female |
| Under 5 Years | 0 (0.0%) | 0 (0.0%) |
| 5 to 17 Years | 0 (0.0%) | 0 (0.0%) |
| 18 to 34 Years | 0 (0.0%) | 0 (0.0%) |
| 35 to 64 Years | 0 (0.0%) | 0 (0.0%) |
| 65 to 74 Years | 50 (18.5%) | 47 (13.3%) |
| 75 Years and over | 17 (9.6%) | 8 (18.2%) |
Disability Class: Vision Difficulty
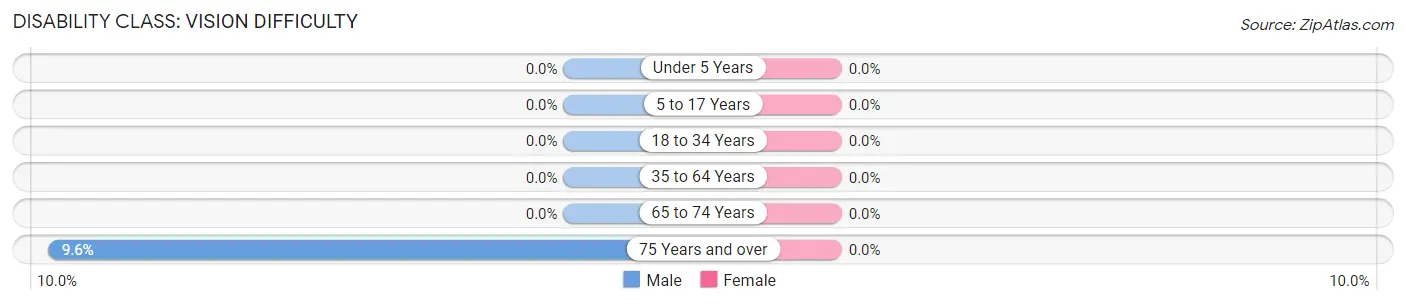
| Age Bracket | Male | Female |
| Under 5 Years | 0 (0.0%) | 0 (0.0%) |
| 5 to 17 Years | 0 (0.0%) | 0 (0.0%) |
| 18 to 34 Years | 0 (0.0%) | 0 (0.0%) |
| 35 to 64 Years | 0 (0.0%) | 0 (0.0%) |
| 65 to 74 Years | 0 (0.0%) | 0 (0.0%) |
| 75 Years and over | 17 (9.6%) | 0 (0.0%) |
Disability Class: Cognitive Difficulty
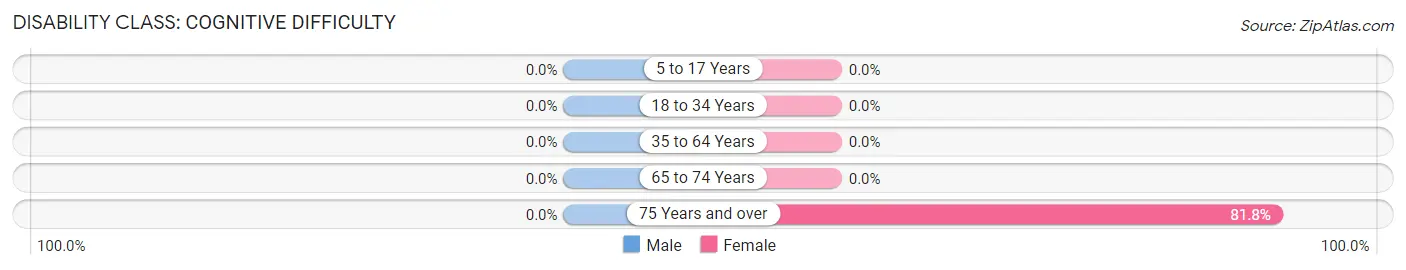
| Age Bracket | Male | Female |
| 5 to 17 Years | 0 (0.0%) | 0 (0.0%) |
| 18 to 34 Years | 0 (0.0%) | 0 (0.0%) |
| 35 to 64 Years | 0 (0.0%) | 0 (0.0%) |
| 65 to 74 Years | 0 (0.0%) | 0 (0.0%) |
| 75 Years and over | 0 (0.0%) | 36 (81.8%) |
Disability Class: Ambulatory Difficulty
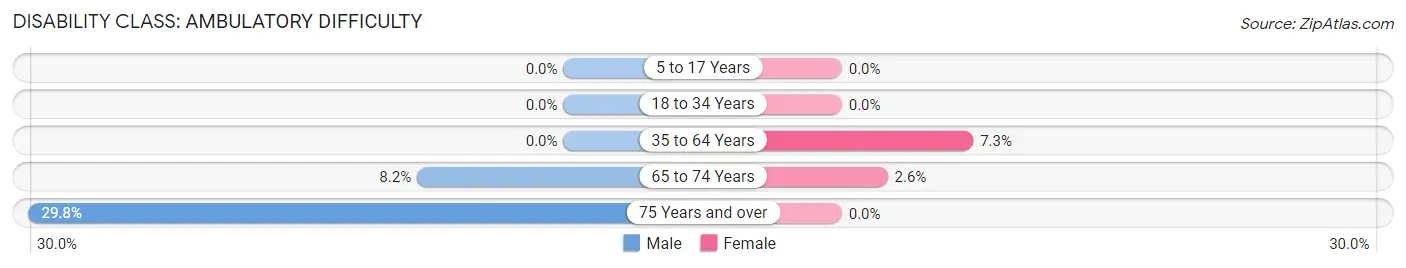
| Age Bracket | Male | Female |
| 5 to 17 Years | 0 (0.0%) | 0 (0.0%) |
| 18 to 34 Years | 0 (0.0%) | 0 (0.0%) |
| 35 to 64 Years | 0 (0.0%) | 18 (7.3%) |
| 65 to 74 Years | 22 (8.2%) | 9 (2.5%) |
| 75 Years and over | 53 (29.8%) | 0 (0.0%) |
Disability Class: Self-Care Difficulty
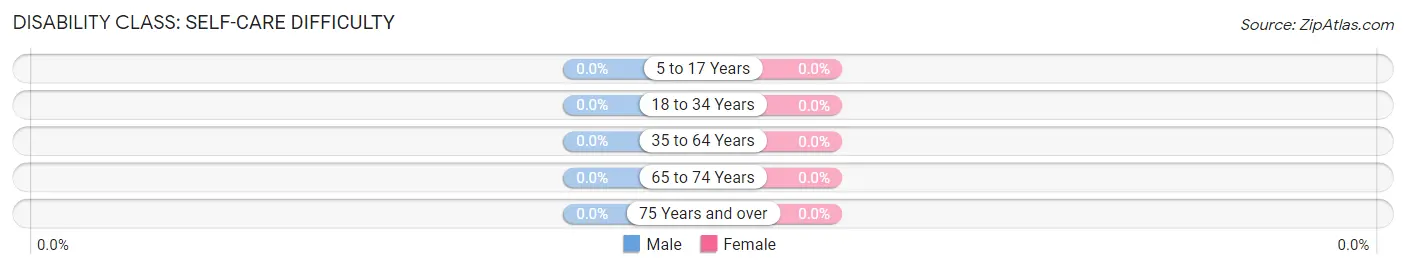
| Age Bracket | Male | Female |
| 5 to 17 Years | 0 (0.0%) | 0 (0.0%) |
| 18 to 34 Years | 0 (0.0%) | 0 (0.0%) |
| 35 to 64 Years | 0 (0.0%) | 0 (0.0%) |
| 65 to 74 Years | 0 (0.0%) | 0 (0.0%) |
| 75 Years and over | 0 (0.0%) | 0 (0.0%) |
Technology Access in Point Clear
Computing Device Access in Point Clear
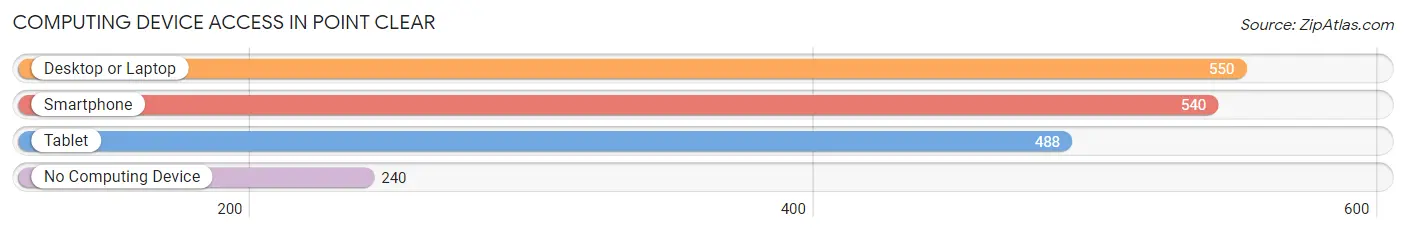
| Device Type | # Households | % Households |
| Desktop or Laptop | 550 | 65.8% |
| Smartphone | 540 | 64.6% |
| Tablet | 488 | 58.4% |
| No Computing Device | 240 | 28.7% |
| Total | 836 | 100.0% |
Internet Access in Point Clear
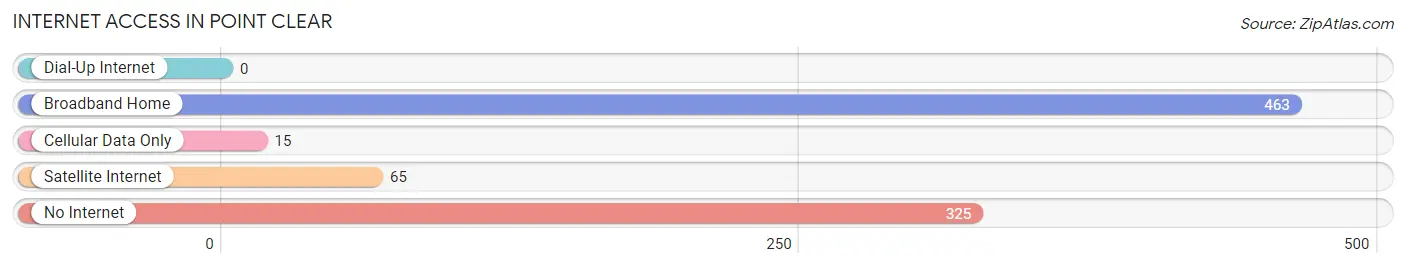
| Internet Type | # Households | % Households |
| Dial-Up Internet | 0 | 0.0% |
| Broadband Home | 463 | 55.4% |
| Cellular Data Only | 15 | 1.8% |
| Satellite Internet | 65 | 7.8% |
| No Internet | 325 | 38.9% |
| Total | 836 | 100.0% |
Point Clear Summary
Point Clear is a small town located in Baldwin County, Alabama, United States. It is situated on the eastern shore of Mobile Bay, approximately 25 miles east of Mobile. The town is part of the Daphne-Fairhope-Foley Metropolitan Statistical Area. As of the 2010 census, the population of Point Clear was 1,264.
History
Point Clear was first settled in the early 1800s by the French, who named it Pointe aux Pins. The area was later settled by the English, who renamed it Point Clear. The town was officially incorporated in 1891.
In the late 19th century, Point Clear became a popular resort destination for wealthy families from the northern United States. The Grand Hotel, which opened in 1847, was a popular destination for these families. The hotel was destroyed by fire in 1934, but was rebuilt and is still in operation today.
Geography
Point Clear is located at 30°30'25" North, 87°47'45" West (30.506944, -87.795833). It is situated on the eastern shore of Mobile Bay, approximately 25 miles east of Mobile. The town has a total area of 2.2 square miles, all of which is land.
Economy
The economy of Point Clear is largely based on tourism. The town is home to several resorts, including the Grand Hotel, which is a popular destination for visitors from all over the United States. The town also has several restaurants, shops, and other businesses that cater to tourists.
Demographics
As of the 2010 census, there were 1,264 people, 545 households, and 339 families residing in Point Clear. The population density was 576.4 people per square mile. The racial makeup of the town was 94.2% White, 2.7% African American, 0.2% Native American, 0.8% Asian, 0.1% Pacific Islander, 0.8% from other races, and 1.2% from two or more races. Hispanic or Latino of any race were 2.2% of the population.
The median income for a household in Point Clear was $50,000, and the median income for a family was $60,000. Males had a median income of $45,000 versus $30,000 for females. The per capita income for the town was $25,000. About 4.2% of families and 6.2% of the population were below the poverty line, including 8.3% of those under age 18 and 4.2% of those age 65 or over.
Common Questions
What is the Total Population of Point Clear?
Total Population of Point Clear is 1,755.
What is the Total Male Population of Point Clear?
Total Male Population of Point Clear is 1,008.
What is the Total Female Population of Point Clear?
Total Female Population of Point Clear is 747.
What is the Ratio of Males per 100 Females in Point Clear?
There are 134.94 Males per 100 Females in Point Clear.
What is the Ratio of Females per 100 Males in Point Clear?
There are 74.11 Females per 100 Males in Point Clear.
What is the Median Population Age in Point Clear?
Median Population Age in Point Clear is 64.0 Years.
What is the Average Family Size in Point Clear
Average Family Size in Point Clear is 2.7 People.
What is the Average Household Size in Point Clear
Average Household Size in Point Clear is 2.1 People.
What is Per Capita Income in Point Clear?
Per Capita income in Point Clear is $91,727.
What is the Median Household income in Point Clear?
Median Household Income in Point Clear is $69,310.
What is Inequality or Gini Index in Point Clear?
Inequality or Gini Index in Point Clear is 0.66.
How Large is the Labor Force in Point Clear?
There are 430 People in the Labor Forcein in Point Clear.
What is the Percentage of People in the Labor Force in Point Clear?
26.5% of People are in the Labor Force in Point Clear.