Midway, AL
Midway Map
Midway Overview
507
TOTAL POPULATION
301
MALE POPULATION
206
FEMALE POPULATION
146.12
MALES / 100 FEMALES
68.44
FEMALES / 100 MALES
48.2
MEDIAN AGE
3.3
AVG FAMILY SIZE
2.2
AVG HOUSEHOLD SIZE
$25,832
PER CAPITA INCOME
$76,000
AVG FAMILY INCOME
$32,000
AVG HOUSEHOLD INCOME
7.0%
WAGE / INCOME GAP [ % ]
93.0¢/ $1
WAGE / INCOME GAP [ $ ]
0.44
INEQUALITY / GINI INDEX
243
LABOR FORCE [ PEOPLE ]
53.6%
PERCENT IN LABOR FORCE
16.0%
UNEMPLOYMENT RATE
Midway Zip Codes
Midway Area Codes
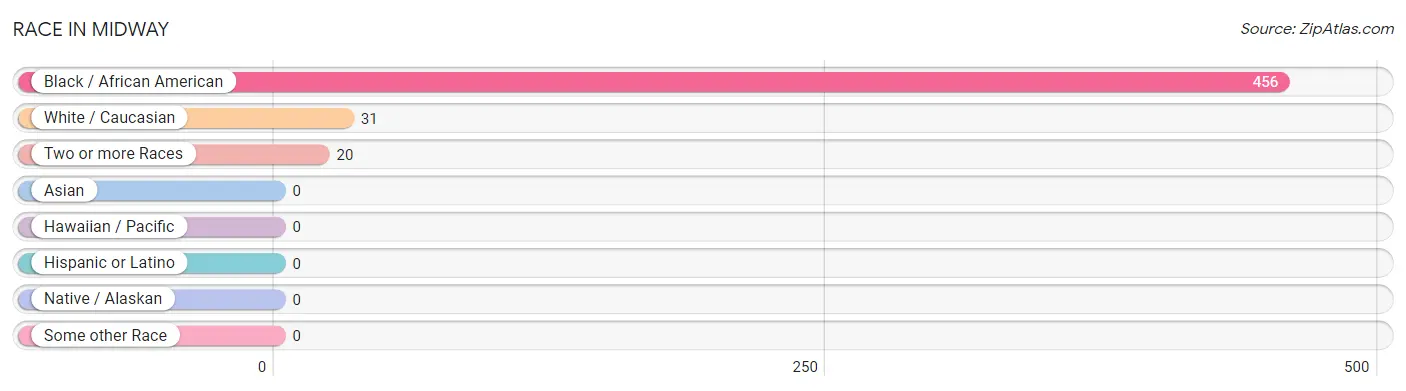
Race in Midway
The most populous races in Midway are Black / African American (456 | 89.9%), White / Caucasian (31 | 6.1%), and Two or more Races (20 | 3.9%).
| Race | # Population | % Population |
| Asian | 0 | 0.0% |
| Black / African American | 456 | 89.9% |
| Hawaiian / Pacific | 0 | 0.0% |
| Hispanic or Latino | 0 | 0.0% |
| Native / Alaskan | 0 | 0.0% |
| White / Caucasian | 31 | 6.1% |
| Two or more Races | 20 | 3.9% |
| Some other Race | 0 | 0.0% |
| Total | 507 | 100.0% |
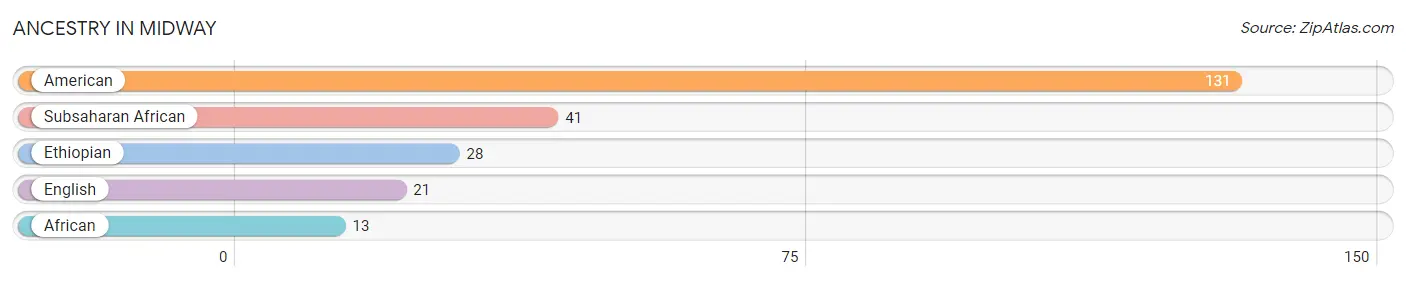
Ancestry in Midway
The most populous ancestries reported in Midway are American (131 | 25.8%), Subsaharan African (41 | 8.1%), Ethiopian (28 | 5.5%), English (21 | 4.1%), and African (13 | 2.6%), together accounting for 46.2% of all Midway residents.
| Ancestry | # Population | % Population |
| African | 13 | 2.6% |
| American | 131 | 25.8% |
| English | 21 | 4.1% |
| Ethiopian | 28 | 5.5% |
| Subsaharan African | 41 | 8.1% | View All 5 Rows |
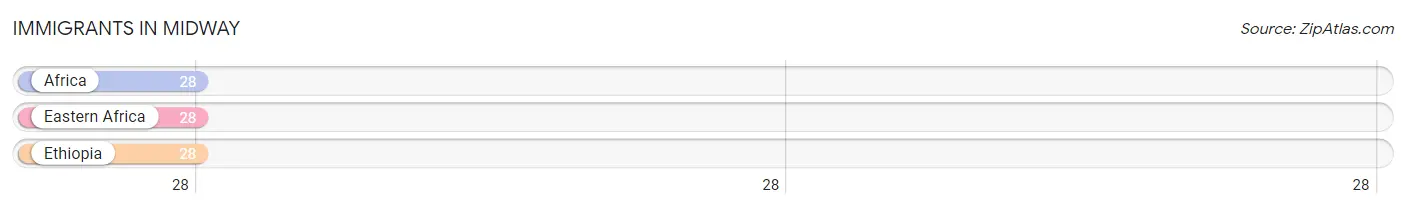
Immigrants in Midway
The most numerous immigrant groups reported in Midway came from Africa (28 | 5.5%), Eastern Africa (28 | 5.5%), and Ethiopia (28 | 5.5%), together accounting for 16.6% of all Midway residents.
| Immigration Origin | # Population | % Population |
| Africa | 28 | 5.5% |
| Eastern Africa | 28 | 5.5% |
| Ethiopia | 28 | 5.5% | View All 3 Rows |
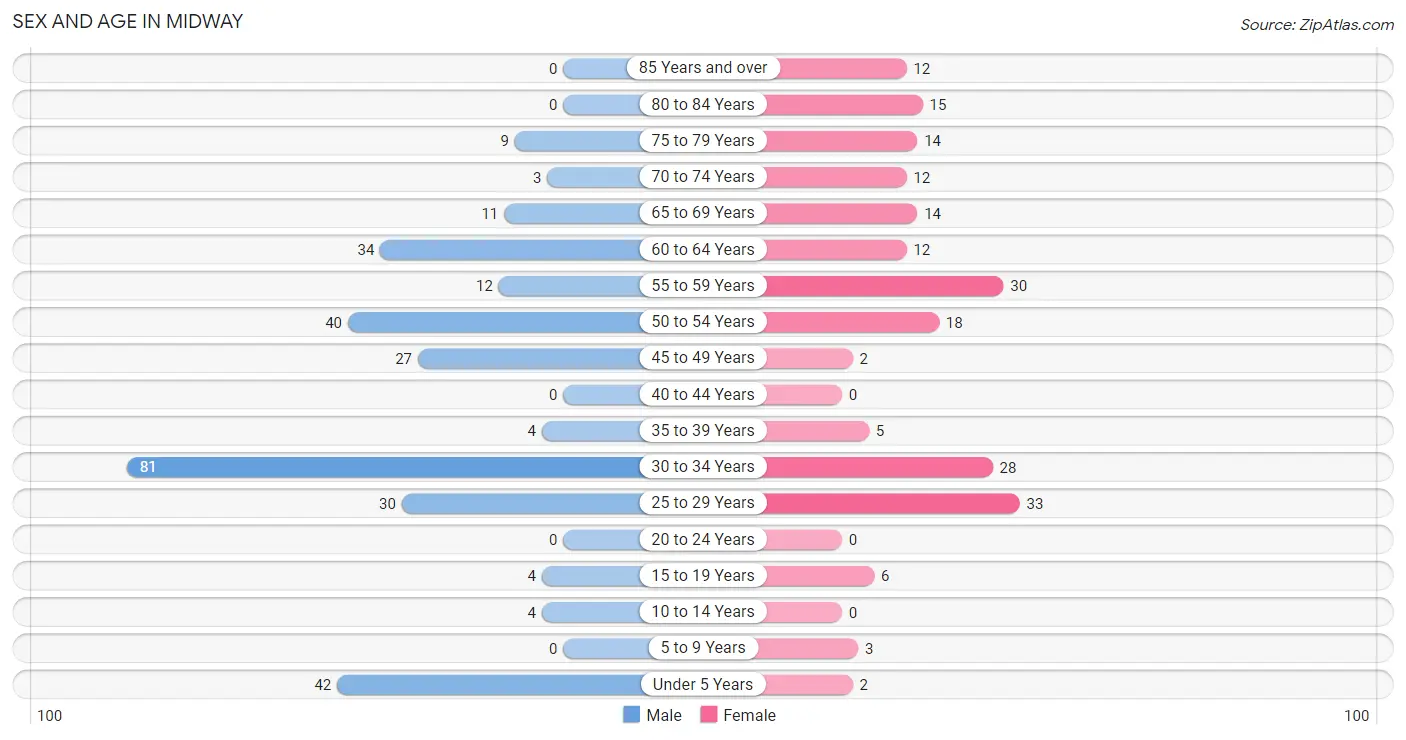
Sex and Age in Midway
Sex and Age in Midway
The most populous age groups in Midway are 30 to 34 Years (81 | 26.9%) for men and 25 to 29 Years (33 | 16.0%) for women.
| Age Bracket | Male | Female |
| Under 5 Years | 42 (14.0%) | 2 (1.0%) |
| 5 to 9 Years | 0 (0.0%) | 3 (1.5%) |
| 10 to 14 Years | 4 (1.3%) | 0 (0.0%) |
| 15 to 19 Years | 4 (1.3%) | 6 (2.9%) |
| 20 to 24 Years | 0 (0.0%) | 0 (0.0%) |
| 25 to 29 Years | 30 (10.0%) | 33 (16.0%) |
| 30 to 34 Years | 81 (26.9%) | 28 (13.6%) |
| 35 to 39 Years | 4 (1.3%) | 5 (2.4%) |
| 40 to 44 Years | 0 (0.0%) | 0 (0.0%) |
| 45 to 49 Years | 27 (9.0%) | 2 (1.0%) |
| 50 to 54 Years | 40 (13.3%) | 18 (8.7%) |
| 55 to 59 Years | 12 (4.0%) | 30 (14.6%) |
| 60 to 64 Years | 34 (11.3%) | 12 (5.8%) |
| 65 to 69 Years | 11 (3.6%) | 14 (6.8%) |
| 70 to 74 Years | 3 (1.0%) | 12 (5.8%) |
| 75 to 79 Years | 9 (3.0%) | 14 (6.8%) |
| 80 to 84 Years | 0 (0.0%) | 15 (7.3%) |
| 85 Years and over | 0 (0.0%) | 12 (5.8%) |
| Total | 301 (100.0%) | 206 (100.0%) |
Families and Households in Midway
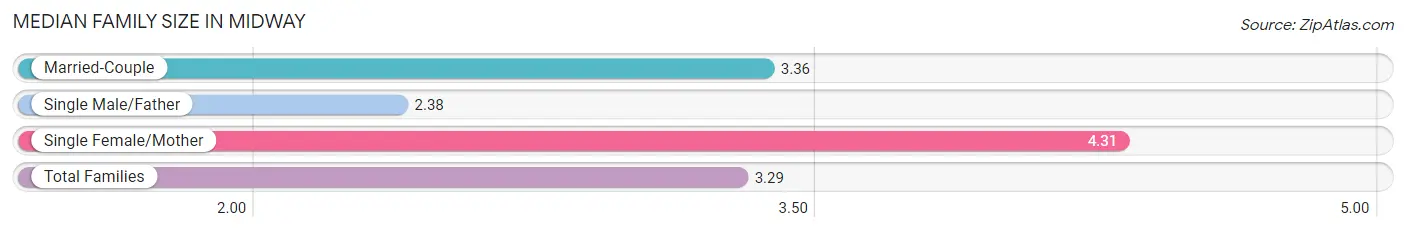
Median Family Size in Midway
The median family size in Midway is 3.29 persons per family, with single female/mother families (39 | 34.8%) accounting for the largest median family size of 4.31 persons per family. On the other hand, single male/father families (45 | 40.2%) represent the smallest median family size with 2.38 persons per family.
| Family Type | # Families | Family Size |
| Married-Couple | 28 (25.0%) | 3.36 |
| Single Male/Father | 45 (40.2%) | 2.38 |
| Single Female/Mother | 39 (34.8%) | 4.31 |
| Total Families | 112 (100.0%) | 3.29 |
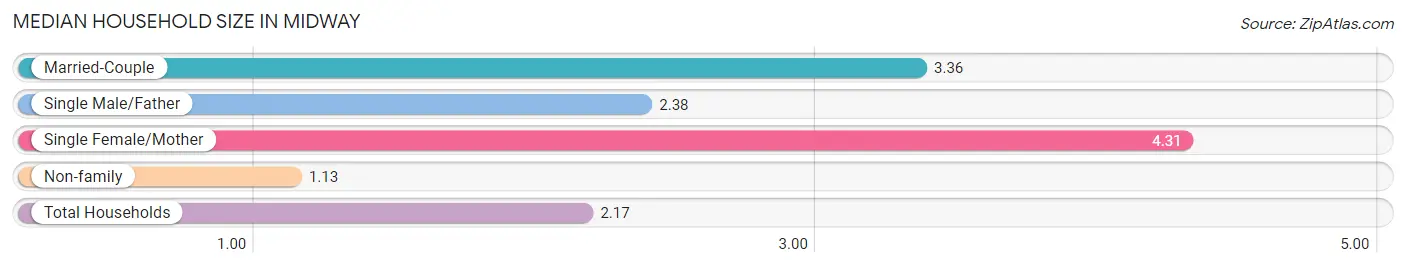
Median Household Size in Midway
The median household size in Midway is 2.17 persons per household, with single female/mother households (39 | 16.7%) accounting for the largest median household size of 4.31 persons per household. non-family households (122 | 52.1%) represent the smallest median household size with 1.13 persons per household.
| Household Type | # Households | Household Size |
| Married-Couple | 28 (12.0%) | 3.36 |
| Single Male/Father | 45 (19.2%) | 2.38 |
| Single Female/Mother | 39 (16.7%) | 4.31 |
| Non-family | 122 (52.1%) | 1.13 |
| Total Households | 234 (100.0%) | 2.17 |
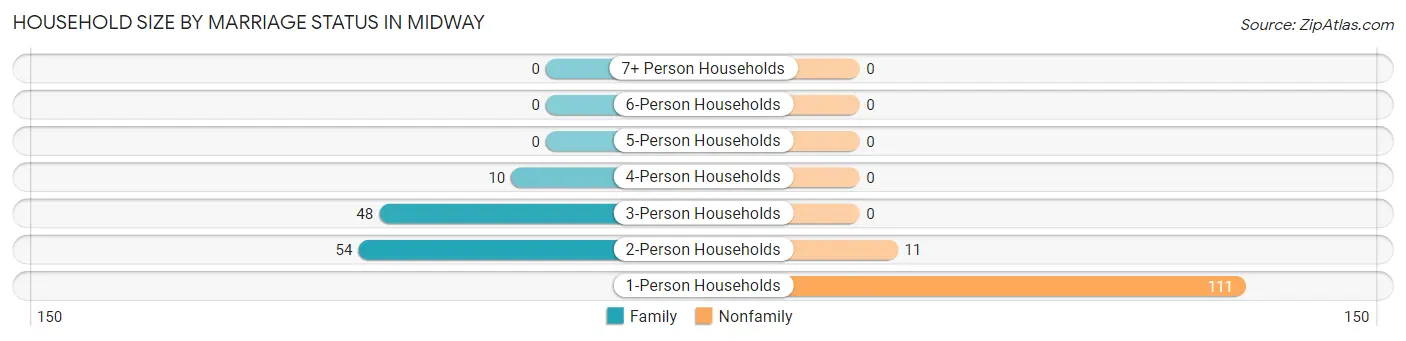
Household Size by Marriage Status in Midway
Out of a total of 234 households in Midway, 112 (47.9%) are family households, while 122 (52.1%) are nonfamily households. The most numerous type of family households are 2-person households, comprising 54, and the most common type of nonfamily households are 1-person households, comprising 111.
| Household Size | Family Households | Nonfamily Households |
| 1-Person Households | - | 111 (47.4%) |
| 2-Person Households | 54 (23.1%) | 11 (4.7%) |
| 3-Person Households | 48 (20.5%) | 0 (0.0%) |
| 4-Person Households | 10 (4.3%) | 0 (0.0%) |
| 5-Person Households | 0 (0.0%) | 0 (0.0%) |
| 6-Person Households | 0 (0.0%) | 0 (0.0%) |
| 7+ Person Households | 0 (0.0%) | 0 (0.0%) |
| Total | 112 (47.9%) | 122 (52.1%) |
Female Fertility in Midway
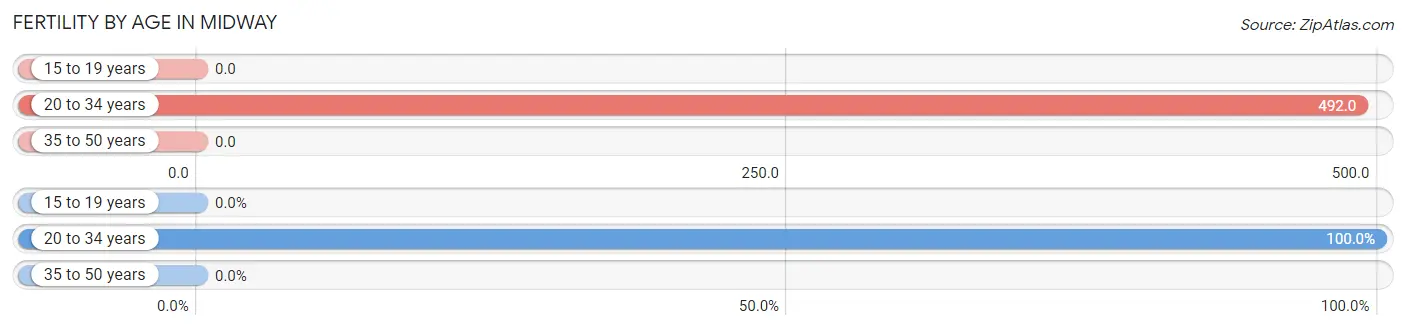
Fertility by Age in Midway
Average fertility rate in Midway is 370.0 births per 1,000 women. Women in the age bracket of 20 to 34 years have the highest fertility rate with 492.0 births per 1,000 women. Women in the age bracket of 20 to 34 years acount for 100.0% of all women with births.
| Age Bracket | Women with Births | Births / 1,000 Women |
| 15 to 19 years | 0 (0.0%) | 0.0 |
| 20 to 34 years | 30 (100.0%) | 492.0 |
| 35 to 50 years | 0 (0.0%) | 0.0 |
| Total | 30 (100.0%) | 370.0 |
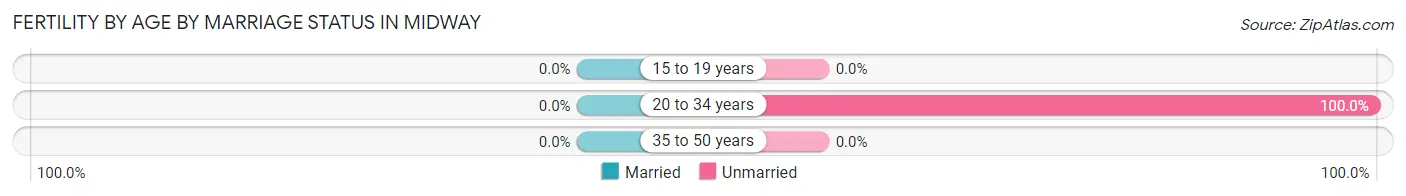
Fertility by Age by Marriage Status in Midway
| Age Bracket | Married | Unmarried |
| 15 to 19 years | 0 (0.0%) | 0 (0.0%) |
| 20 to 34 years | 0 (0.0%) | 30 (100.0%) |
| 35 to 50 years | 0 (0.0%) | 0 (0.0%) |
| Total | 0 (0.0%) | 30 (100.0%) |
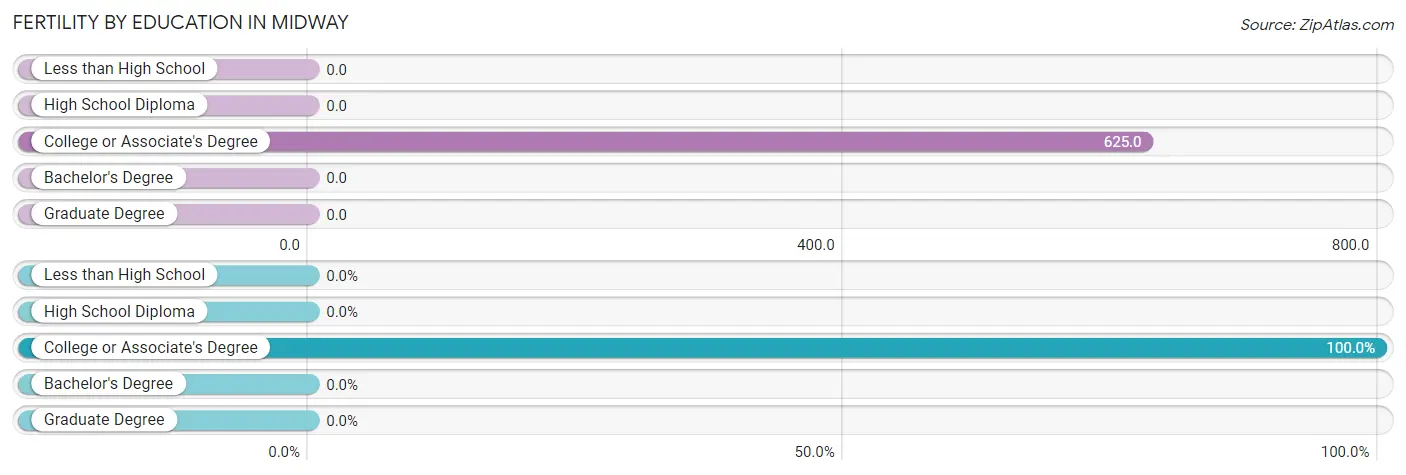
Fertility by Education in Midway
| Educational Attainment | Women with Births | Births / 1,000 Women |
| Less than High School | 0 (0.0%) | 0.0 |
| High School Diploma | 0 (0.0%) | 0.0 |
| College or Associate's Degree | 30 (100.0%) | 625.0 |
| Bachelor's Degree | 0 (0.0%) | 0.0 |
| Graduate Degree | 0 (0.0%) | 0.0 |
| Total | 30 (100.0%) | 370.0 |
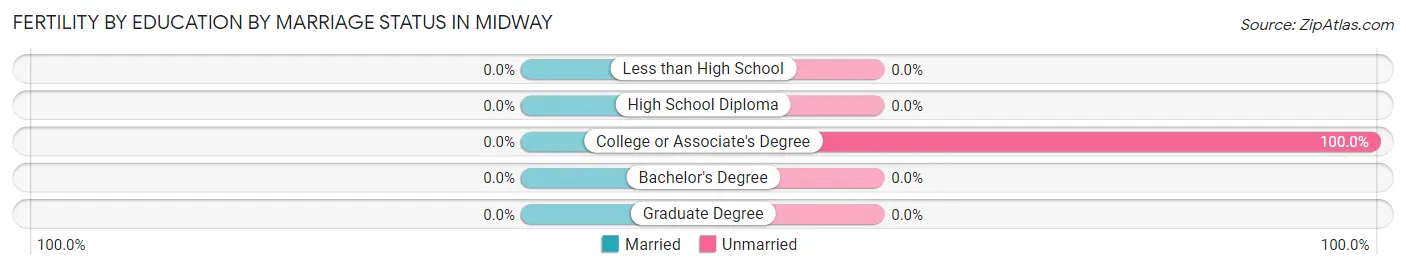
Fertility by Education by Marriage Status in Midway
| Educational Attainment | Married | Unmarried |
| Less than High School | 0 (0.0%) | 0 (0.0%) |
| High School Diploma | 0 (0.0%) | 0 (0.0%) |
| College or Associate's Degree | 0 (0.0%) | 30 (100.0%) |
| Bachelor's Degree | 0 (0.0%) | 0 (0.0%) |
| Graduate Degree | 0 (0.0%) | 0 (0.0%) |
| Total | 0 (0.0%) | 30 (100.0%) |
Income in Midway
Income Overview in Midway
Per Capita Income in Midway is $25,832, while median incomes of families and households are $76,000 and $32,000 respectively.
| Characteristic | Number | Measure |
| Per Capita Income | 507 | $25,832 |
| Median Family Income | 112 | $76,000 |
| Mean Family Income | 112 | $74,673 |
| Median Household Income | 234 | $32,000 |
| Mean Household Income | 234 | $46,408 |
| Income Deficit | 112 | $0 |
| Wage / Income Gap (%) | 507 | 7.04% |
| Wage / Income Gap ($) | 507 | 92.96¢ per $1 |
| Gini / Inequality Index | 507 | 0.44 |
Earnings by Sex in Midway
Average Earnings in Midway are $32,667, $33,167 for men and $30,833 for women, a difference of 7.0%.
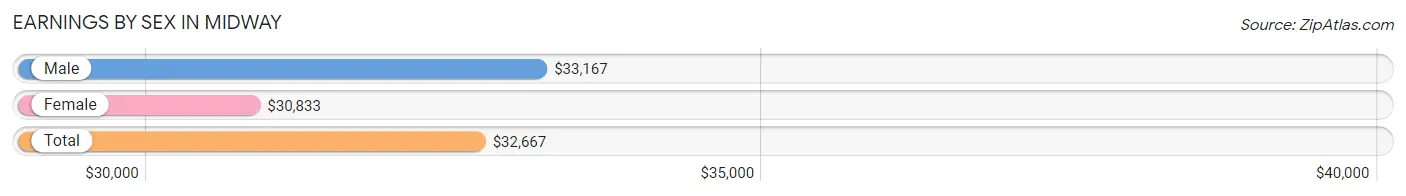
| Sex | Number | Average Earnings |
| Male | 170 (65.4%) | $33,167 |
| Female | 90 (34.6%) | $30,833 |
| Total | 260 (100.0%) | $32,667 |
Earnings by Sex by Income Bracket in Midway
The most common earnings brackets in Midway are $25,000 to $29,999 for men (35 | 20.6%) and $40,000 to $44,999 for women (32 | 35.6%).
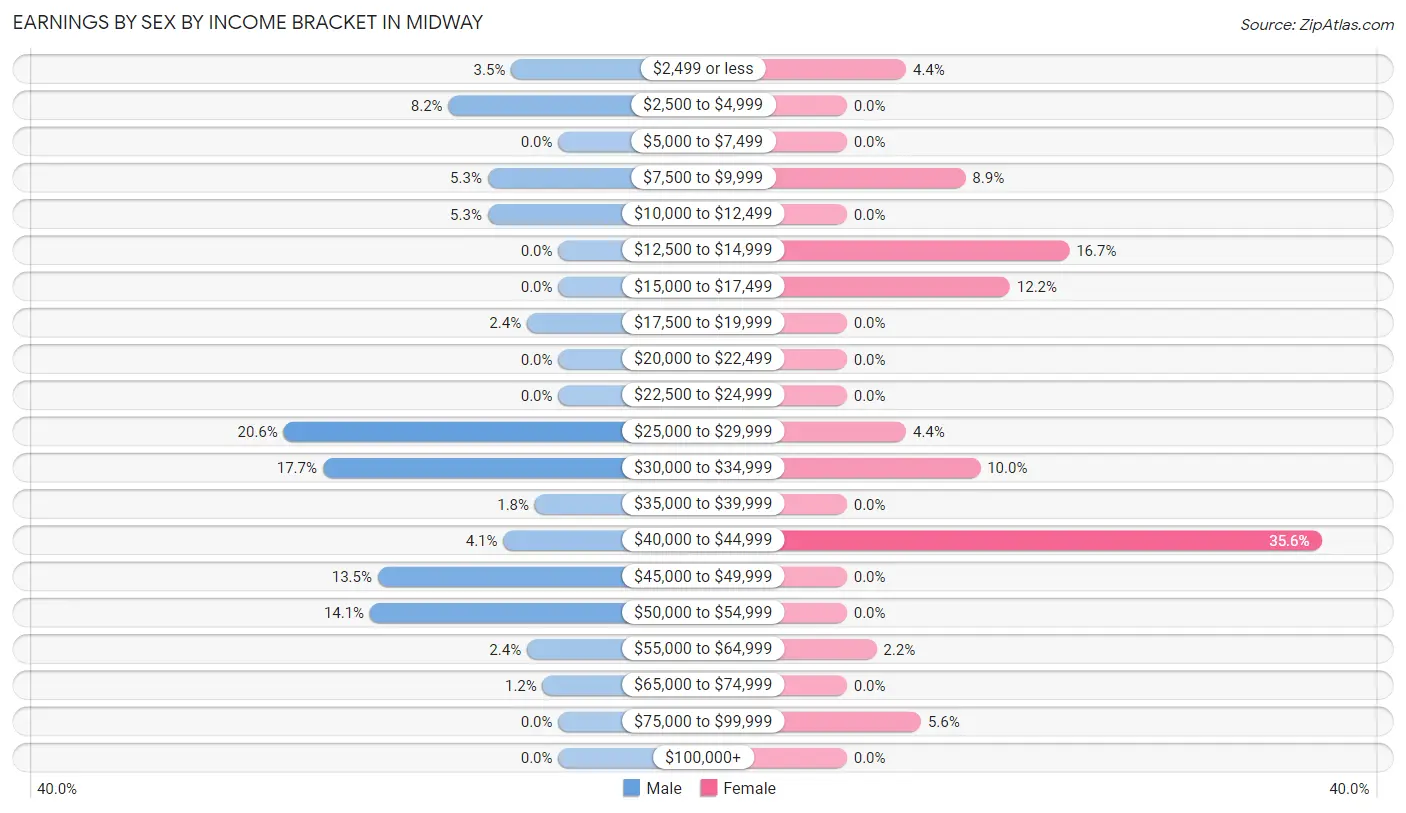
| Income | Male | Female |
| $2,499 or less | 6 (3.5%) | 4 (4.4%) |
| $2,500 to $4,999 | 14 (8.2%) | 0 (0.0%) |
| $5,000 to $7,499 | 0 (0.0%) | 0 (0.0%) |
| $7,500 to $9,999 | 9 (5.3%) | 8 (8.9%) |
| $10,000 to $12,499 | 9 (5.3%) | 0 (0.0%) |
| $12,500 to $14,999 | 0 (0.0%) | 15 (16.7%) |
| $15,000 to $17,499 | 0 (0.0%) | 11 (12.2%) |
| $17,500 to $19,999 | 4 (2.4%) | 0 (0.0%) |
| $20,000 to $22,499 | 0 (0.0%) | 0 (0.0%) |
| $22,500 to $24,999 | 0 (0.0%) | 0 (0.0%) |
| $25,000 to $29,999 | 35 (20.6%) | 4 (4.4%) |
| $30,000 to $34,999 | 30 (17.6%) | 9 (10.0%) |
| $35,000 to $39,999 | 3 (1.8%) | 0 (0.0%) |
| $40,000 to $44,999 | 7 (4.1%) | 32 (35.6%) |
| $45,000 to $49,999 | 23 (13.5%) | 0 (0.0%) |
| $50,000 to $54,999 | 24 (14.1%) | 0 (0.0%) |
| $55,000 to $64,999 | 4 (2.4%) | 2 (2.2%) |
| $65,000 to $74,999 | 2 (1.2%) | 0 (0.0%) |
| $75,000 to $99,999 | 0 (0.0%) | 5 (5.6%) |
| $100,000+ | 0 (0.0%) | 0 (0.0%) |
| Total | 170 (100.0%) | 90 (100.0%) |
Earnings by Sex by Educational Attainment in Midway
Average earnings in Midway are $33,333 for men and $31,250 for women, a difference of 6.2%. Men with an educational attainment of college or associate's degree enjoy the highest average annual earnings of $34,792, while those with high school diploma education earn the least with $28,500. Women with an educational attainment of college or associate's degree earn the most with the average annual earnings of $43,527, while those with high school diploma education have the smallest earnings of $15,114.
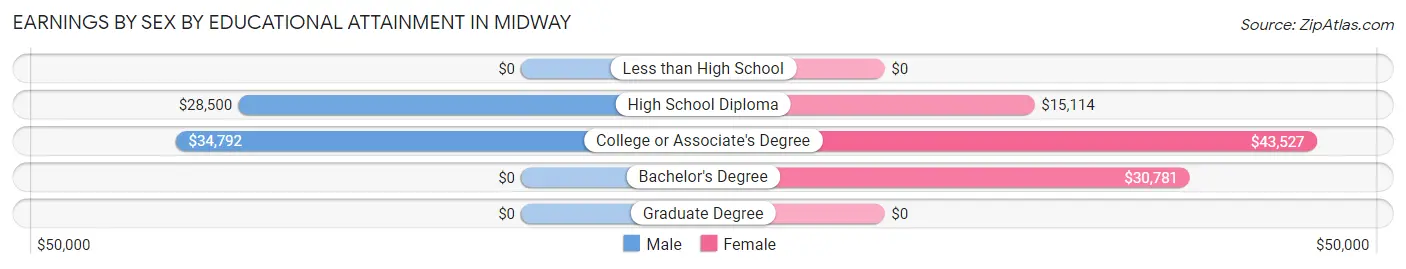
| Educational Attainment | Male Income | Female Income |
| Less than High School | - | - |
| High School Diploma | $28,500 | $15,114 |
| College or Associate's Degree | $34,792 | $43,527 |
| Bachelor's Degree | - | - |
| Graduate Degree | - | - |
| Total | $33,333 | $31,250 |
Family Income in Midway
Family Income Brackets in Midway
According to the Midway family income data, there are 49 families falling into the $75,000 to $99,999 income range, which is the most common income bracket and makes up 43.8% of all families.
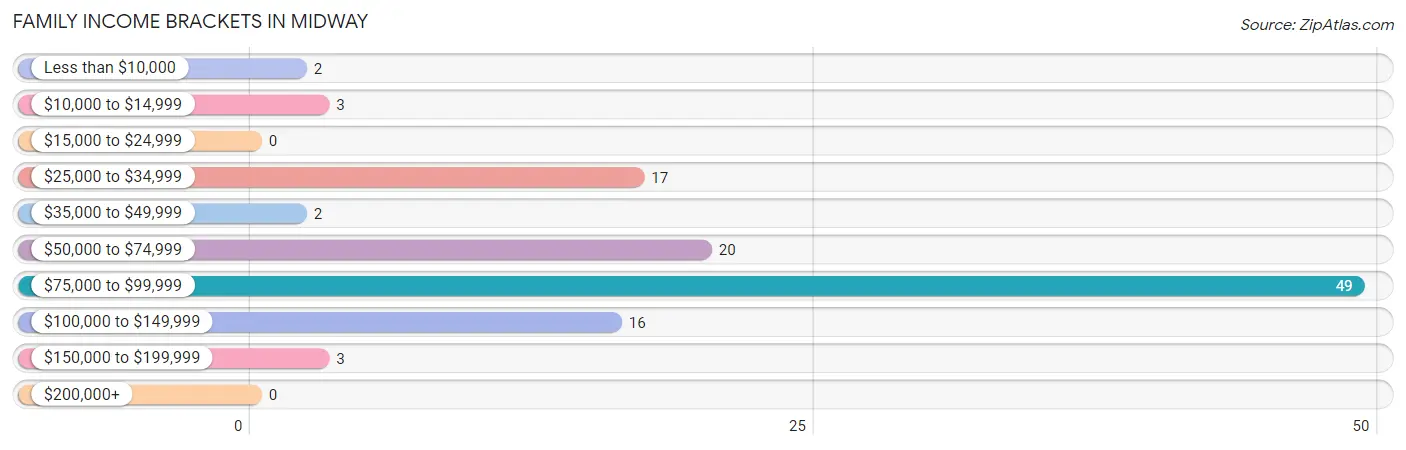
| Income Bracket | # Families | % Families |
| Less than $10,000 | 2 | 1.8% |
| $10,000 to $14,999 | 3 | 2.7% |
| $15,000 to $24,999 | 0 | 0.0% |
| $25,000 to $34,999 | 17 | 15.2% |
| $35,000 to $49,999 | 2 | 1.8% |
| $50,000 to $74,999 | 20 | 17.9% |
| $75,000 to $99,999 | 49 | 43.8% |
| $100,000 to $149,999 | 16 | 14.3% |
| $150,000 to $199,999 | 3 | 2.7% |
| $200,000+ | 0 | 0.0% |
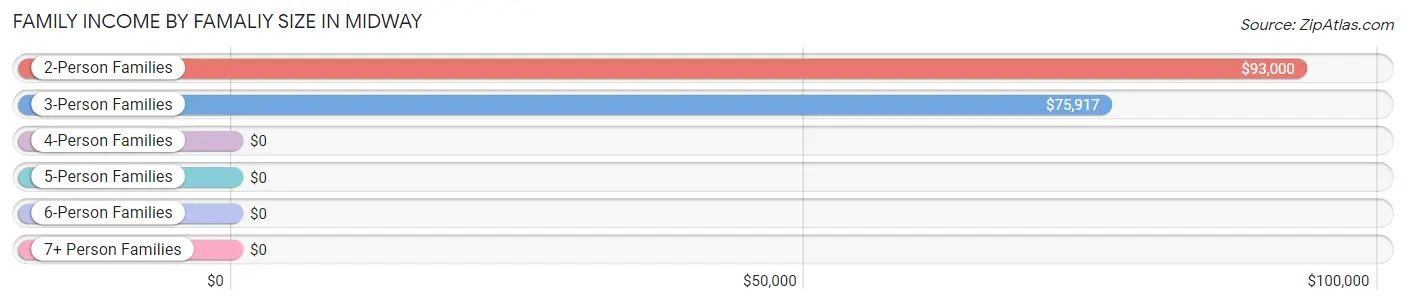
Family Income by Famaliy Size in Midway
2-person families (54 | 48.2%) account for the highest median family income in Midway with $93,000 per family, while 2-person families (54 | 48.2%) have the highest median income of $46,500 per family member.
| Income Bracket | # Families | Median Income |
| 2-Person Families | 54 (48.2%) | $93,000 |
| 3-Person Families | 48 (42.9%) | $75,917 |
| 4-Person Families | 10 (8.9%) | $0 |
| 5-Person Families | 0 (0.0%) | $0 |
| 6-Person Families | 0 (0.0%) | $0 |
| 7+ Person Families | 0 (0.0%) | $0 |
| Total | 112 (100.0%) | $76,000 |
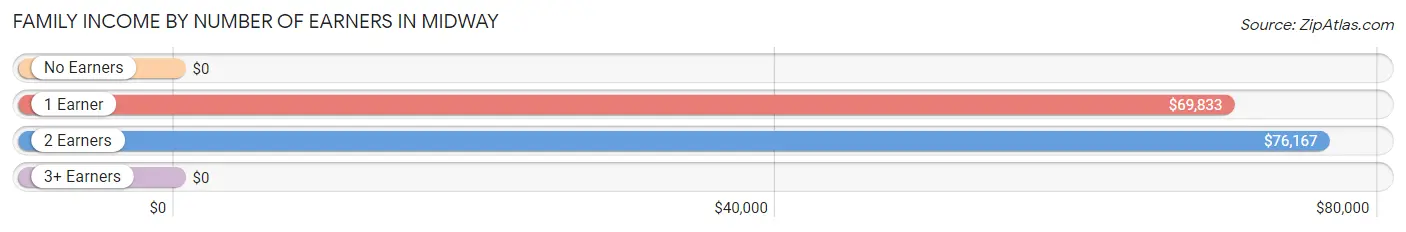
Family Income by Number of Earners in Midway
| Number of Earners | # Families | Median Income |
| No Earners | 5 (4.5%) | $0 |
| 1 Earner | 58 (51.8%) | $69,833 |
| 2 Earners | 46 (41.1%) | $76,167 |
| 3+ Earners | 3 (2.7%) | $0 |
| Total | 112 (100.0%) | $76,000 |
Household Income in Midway
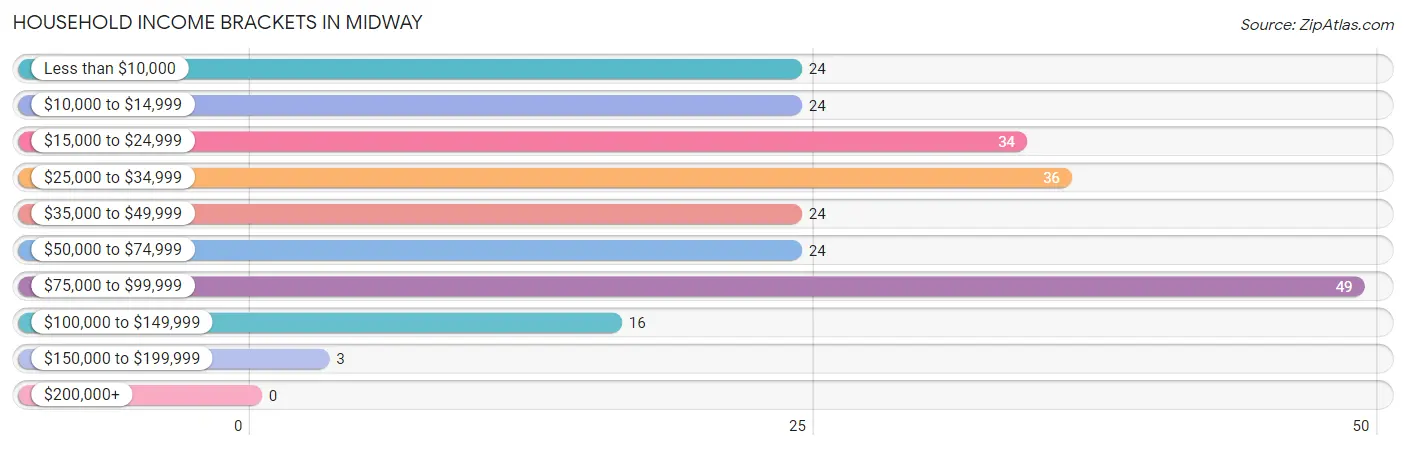
Household Income Brackets in Midway
With 49 households falling in the category, the $75,000 to $99,999 income range is the most frequent in Midway, accounting for 20.9% of all households.
| Income Bracket | # Households | % Households |
| Less than $10,000 | 24 | 10.3% |
| $10,000 to $14,999 | 24 | 10.3% |
| $15,000 to $24,999 | 34 | 14.5% |
| $25,000 to $34,999 | 36 | 15.4% |
| $35,000 to $49,999 | 24 | 10.3% |
| $50,000 to $74,999 | 24 | 10.3% |
| $75,000 to $99,999 | 49 | 20.9% |
| $100,000 to $149,999 | 16 | 6.8% |
| $150,000 to $199,999 | 3 | 1.3% |
| $200,000+ | 0 | 0.0% |
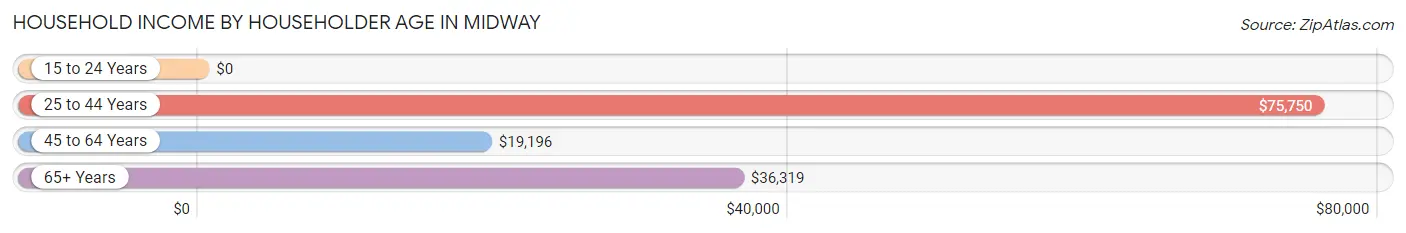
Household Income by Householder Age in Midway
The median household income in Midway is $32,000, with the highest median household income of $75,750 found in the 25 to 44 years age bracket for the primary householder. A total of 42 households (17.9%) fall into this category.
| Income Bracket | # Households | Median Income |
| 15 to 24 Years | 0 (0.0%) | $0 |
| 25 to 44 Years | 42 (17.9%) | $75,750 |
| 45 to 64 Years | 113 (48.3%) | $19,196 |
| 65+ Years | 79 (33.8%) | $36,319 |
| Total | 234 (100.0%) | $32,000 |
Poverty in Midway
Income Below Poverty by Sex and Age in Midway
With 17.3% poverty level for males and 15.5% for females among the residents of Midway, 6 to 11 year old males and under 5 year old females are the most vulnerable to poverty, with 2 males (100.0%) and 2 females (100.0%) in their respective age groups living below the poverty level.
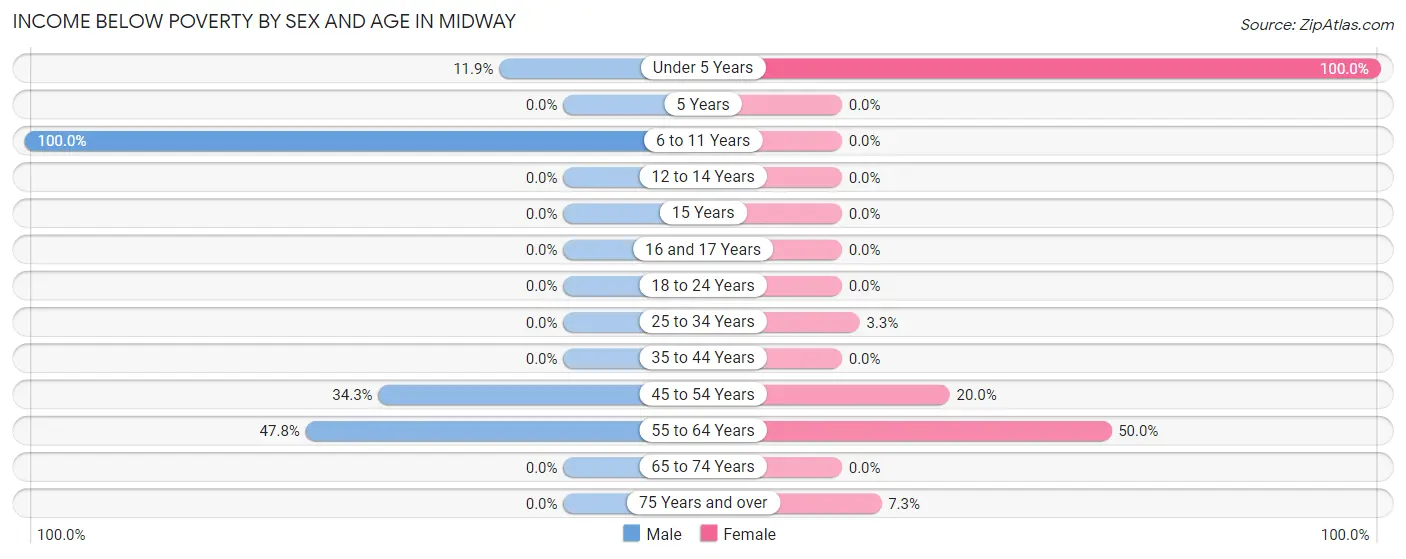
| Age Bracket | Male | Female |
| Under 5 Years | 5 (11.9%) | 2 (100.0%) |
| 5 Years | 0 (0.0%) | 0 (0.0%) |
| 6 to 11 Years | 2 (100.0%) | 0 (0.0%) |
| 12 to 14 Years | 0 (0.0%) | 0 (0.0%) |
| 15 Years | 0 (0.0%) | 0 (0.0%) |
| 16 and 17 Years | 0 (0.0%) | 0 (0.0%) |
| 18 to 24 Years | 0 (0.0%) | 0 (0.0%) |
| 25 to 34 Years | 0 (0.0%) | 2 (3.3%) |
| 35 to 44 Years | 0 (0.0%) | 0 (0.0%) |
| 45 to 54 Years | 23 (34.3%) | 4 (20.0%) |
| 55 to 64 Years | 22 (47.8%) | 21 (50.0%) |
| 65 to 74 Years | 0 (0.0%) | 0 (0.0%) |
| 75 Years and over | 0 (0.0%) | 3 (7.3%) |
| Total | 52 (17.3%) | 32 (15.5%) |
Income Above Poverty by Sex and Age in Midway
According to the poverty statistics in Midway, males aged 12 to 14 years and females aged 6 to 11 years are the age groups that are most secure financially, with 100.0% of males and 100.0% of females in these age groups living above the poverty line.
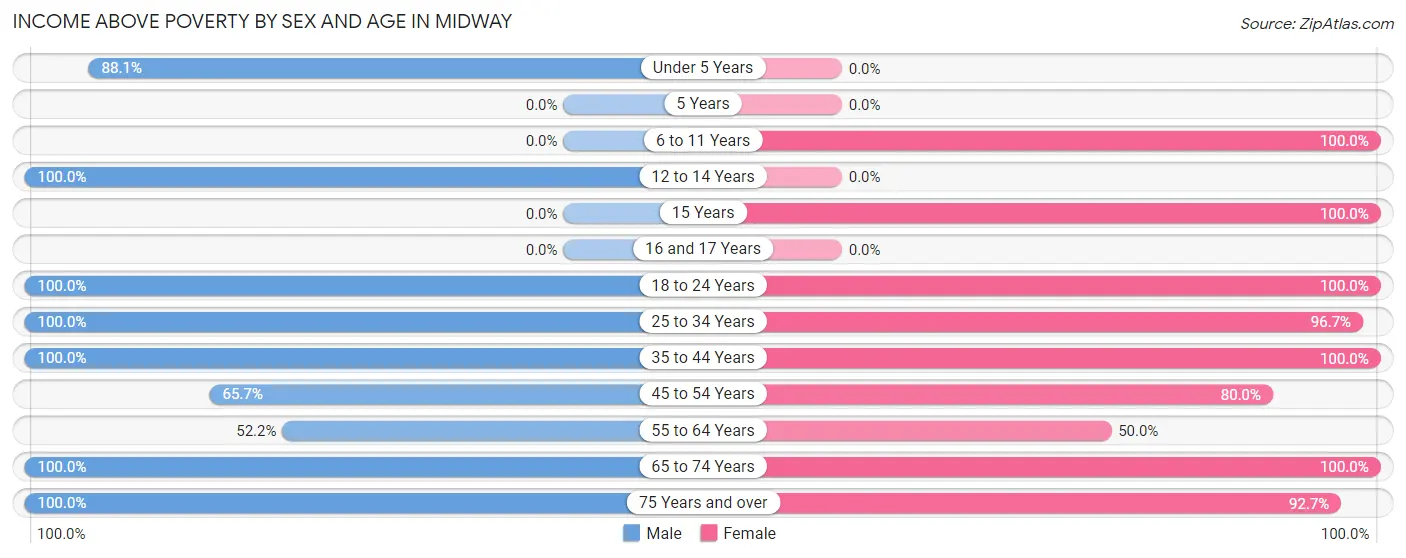
| Age Bracket | Male | Female |
| Under 5 Years | 37 (88.1%) | 0 (0.0%) |
| 5 Years | 0 (0.0%) | 0 (0.0%) |
| 6 to 11 Years | 0 (0.0%) | 3 (100.0%) |
| 12 to 14 Years | 2 (100.0%) | 0 (0.0%) |
| 15 Years | 0 (0.0%) | 3 (100.0%) |
| 16 and 17 Years | 0 (0.0%) | 0 (0.0%) |
| 18 to 24 Years | 4 (100.0%) | 3 (100.0%) |
| 25 to 34 Years | 111 (100.0%) | 59 (96.7%) |
| 35 to 44 Years | 4 (100.0%) | 5 (100.0%) |
| 45 to 54 Years | 44 (65.7%) | 16 (80.0%) |
| 55 to 64 Years | 24 (52.2%) | 21 (50.0%) |
| 65 to 74 Years | 14 (100.0%) | 26 (100.0%) |
| 75 Years and over | 9 (100.0%) | 38 (92.7%) |
| Total | 249 (82.7%) | 174 (84.5%) |
Income Below Poverty Among Married-Couple Families in Midway
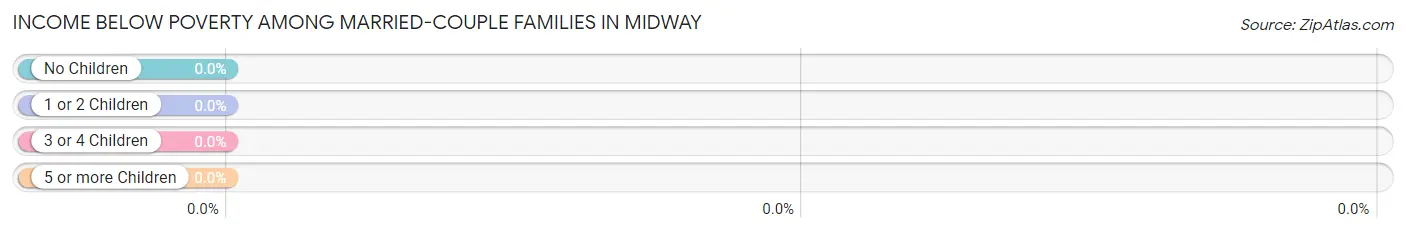
| Children | Above Poverty | Below Poverty |
| No Children | 18 (100.0%) | 0 (0.0%) |
| 1 or 2 Children | 10 (100.0%) | 0 (0.0%) |
| 3 or 4 Children | 0 (0.0%) | 0 (0.0%) |
| 5 or more Children | 0 (0.0%) | 0 (0.0%) |
| Total | 28 (100.0%) | 0 (0.0%) |
Income Below Poverty Among Single-Parent Households in Midway
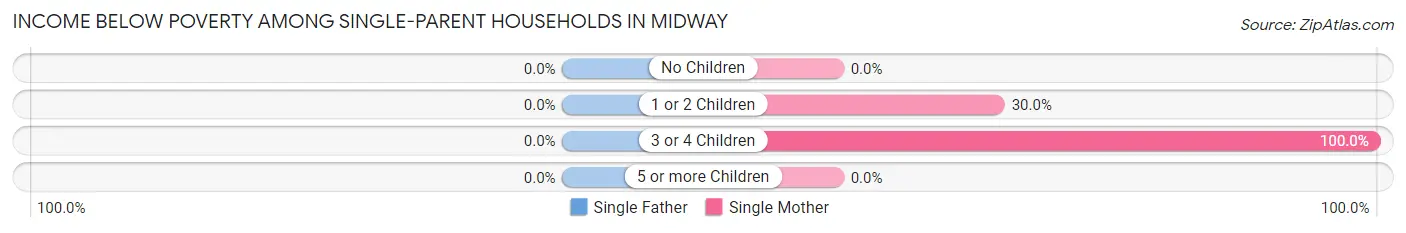
| Children | Single Father | Single Mother |
| No Children | 0 (0.0%) | 0 (0.0%) |
| 1 or 2 Children | 0 (0.0%) | 3 (30.0%) |
| 3 or 4 Children | 0 (0.0%) | 2 (100.0%) |
| 5 or more Children | 0 (0.0%) | 0 (0.0%) |
| Total | 0 (0.0%) | 5 (12.8%) |
Income Below Poverty Among Married-Couple vs Single-Parent Households in Midway
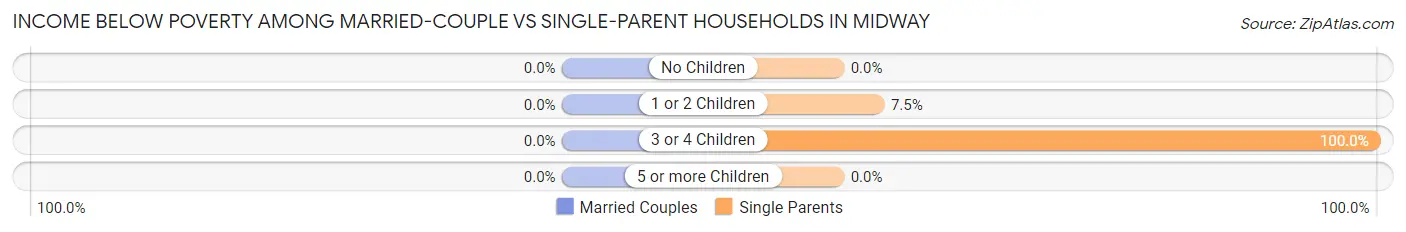
| Children | Married-Couple Families | Single-Parent Households |
| No Children | 0 (0.0%) | 0 (0.0%) |
| 1 or 2 Children | 0 (0.0%) | 3 (7.5%) |
| 3 or 4 Children | 0 (0.0%) | 2 (100.0%) |
| 5 or more Children | 0 (0.0%) | 0 (0.0%) |
| Total | 0 (0.0%) | 5 (5.9%) |
Employment Characteristics in Midway
Employment by Class of Employer in Midway
Among the 179 employed individuals in Midway, private company employees (117 | 65.4%), state government employees (45 | 25.1%), and local government employees (13 | 7.3%) make up the most common classes of employment.
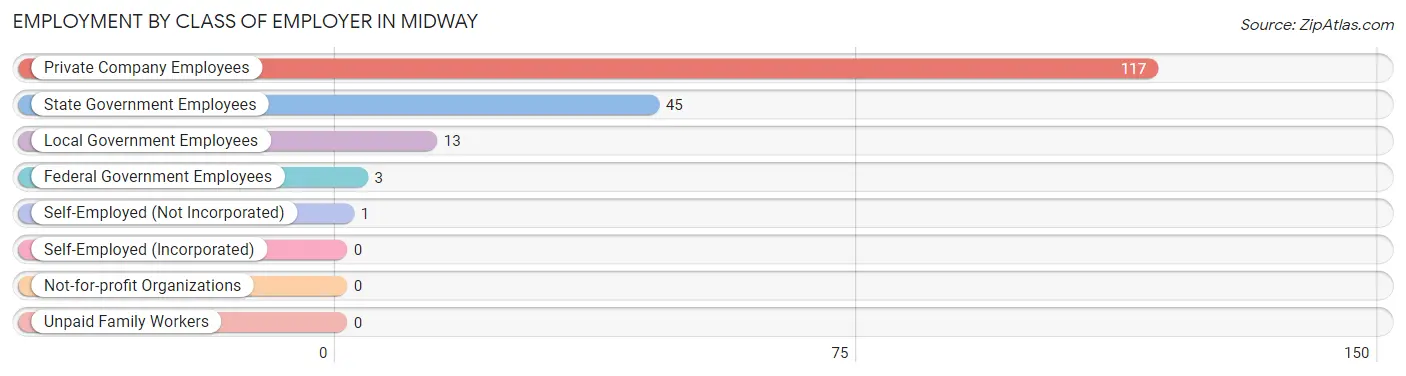
| Employer Class | # Employees | % Employees |
| Private Company Employees | 117 | 65.4% |
| Self-Employed (Incorporated) | 0 | 0.0% |
| Self-Employed (Not Incorporated) | 1 | 0.6% |
| Not-for-profit Organizations | 0 | 0.0% |
| Local Government Employees | 13 | 7.3% |
| State Government Employees | 45 | 25.1% |
| Federal Government Employees | 3 | 1.7% |
| Unpaid Family Workers | 0 | 0.0% |
| Total | 179 | 100.0% |
Employment Status by Age in Midway
According to the labor force statistics for Midway, out of the total population over 16 years of age (453), 53.6% or 243 individuals are in the labor force, with 16.0% or 39 of them unemployed. The age group with the highest labor force participation rate is 30 to 34 years, with 90.8% or 99 individuals in the labor force. Within the labor force, the 16 to 19 years age range has the highest percentage of unemployed individuals, with 100.0% or 4 of them being unemployed.
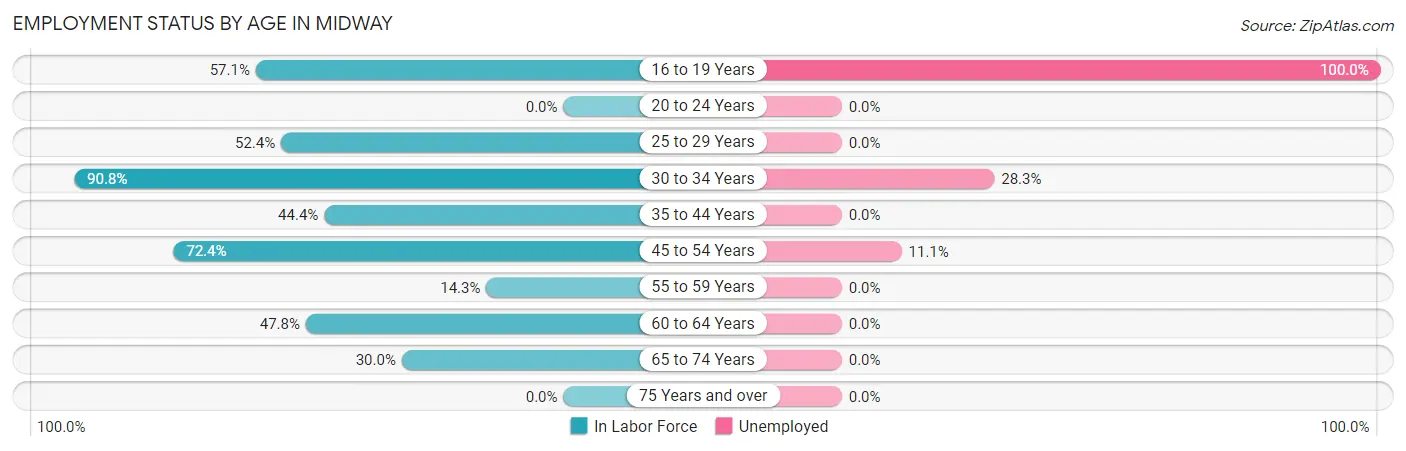
| Age Bracket | In Labor Force | Unemployed |
| 16 to 19 Years | 4 (57.1%) | 4 (100.0%) |
| 20 to 24 Years | 0 (0.0%) | 0 (0.0%) |
| 25 to 29 Years | 33 (52.4%) | 0 (0.0%) |
| 30 to 34 Years | 99 (90.8%) | 28 (28.3%) |
| 35 to 44 Years | 4 (44.4%) | 0 (0.0%) |
| 45 to 54 Years | 63 (72.4%) | 7 (11.1%) |
| 55 to 59 Years | 6 (14.3%) | 0 (0.0%) |
| 60 to 64 Years | 22 (47.8%) | 0 (0.0%) |
| 65 to 74 Years | 12 (30.0%) | 0 (0.0%) |
| 75 Years and over | 0 (0.0%) | 0 (0.0%) |
| Total | 243 (53.6%) | 39 (16.0%) |
Employment Status by Educational Attainment in Midway
According to labor force statistics for Midway, 63.8% of individuals (227) out of the total population between 25 and 64 years of age (356) are in the labor force, with 15.4% or 35 of them being unemployed. The group with the highest labor force participation rate are those with the educational attainment of bachelor's degree or higher, with 94.4% or 17 individuals in the labor force. Within the labor force, individuals with less than high school education have the highest percentage of unemployment, with 25.7% or 9 of them being unemployed.
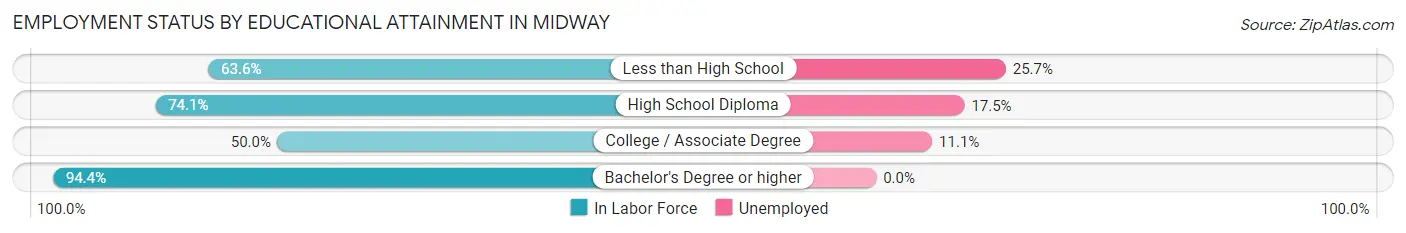
| Educational Attainment | In Labor Force | Unemployed |
| Less than High School | 35 (63.6%) | 14 (25.7%) |
| High School Diploma | 103 (74.1%) | 24 (17.5%) |
| College / Associate Degree | 72 (50.0%) | 16 (11.1%) |
| Bachelor's Degree or higher | 17 (94.4%) | 0 (0.0%) |
| Total | 227 (63.8%) | 55 (15.4%) |
Employment Occupations by Sex in Midway
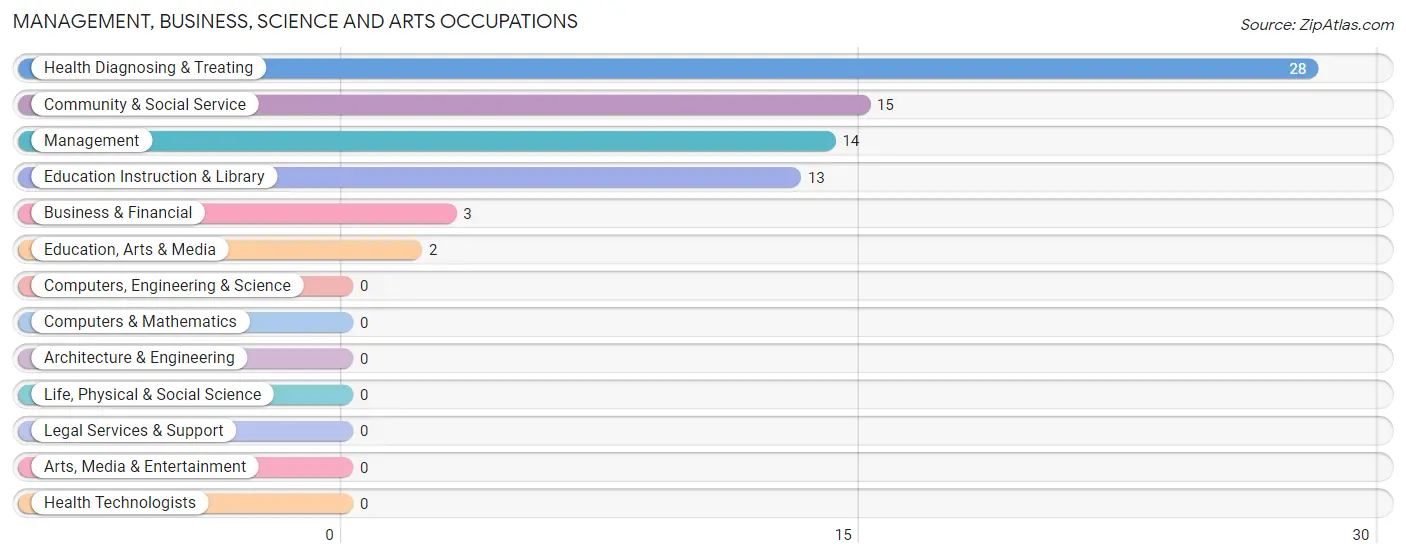
Management, Business, Science and Arts Occupations
The most common Management, Business, Science and Arts occupations in Midway are Health Diagnosing & Treating (28 | 13.7%), Community & Social Service (15 | 7.3%), Management (14 | 6.9%), Education Instruction & Library (13 | 6.4%), and Business & Financial (3 | 1.5%).
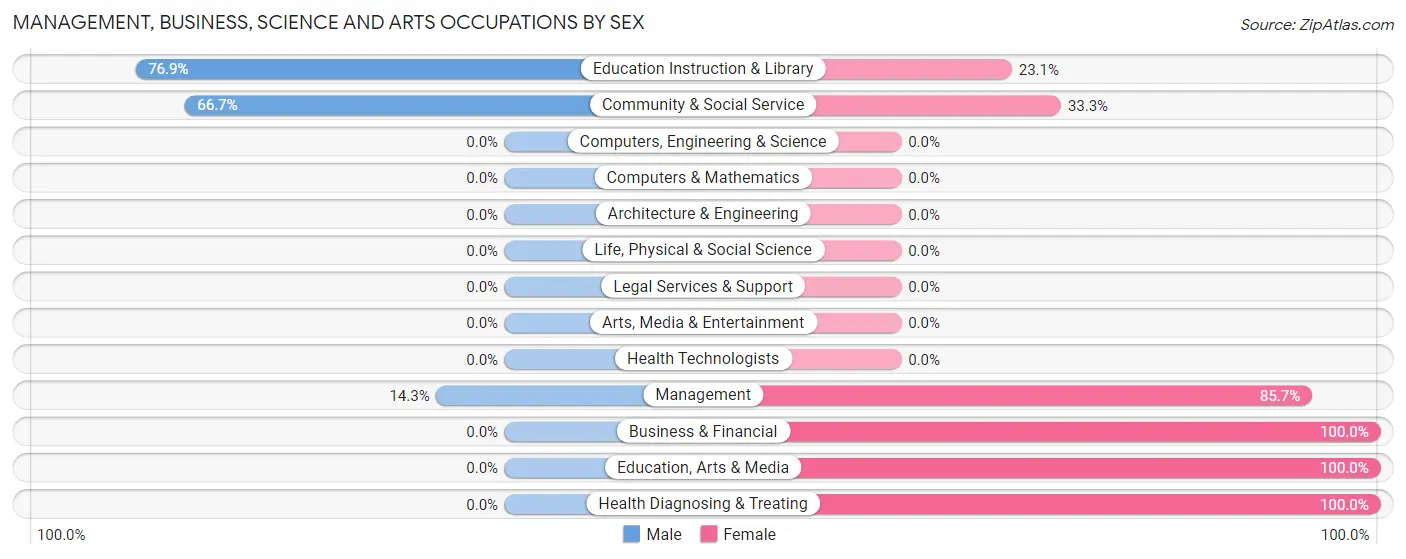
Management, Business, Science and Arts Occupations by Sex
Within the Management, Business, Science and Arts occupations in Midway, the most male-oriented occupations are Education Instruction & Library (76.9%), Community & Social Service (66.7%), and Management (14.3%), while the most female-oriented occupations are Business & Financial (100.0%), Education, Arts & Media (100.0%), and Health Diagnosing & Treating (100.0%).
| Occupation | Male | Female |
| Management | 2 (14.3%) | 12 (85.7%) |
| Business & Financial | 0 (0.0%) | 3 (100.0%) |
| Computers, Engineering & Science | 0 (0.0%) | 0 (0.0%) |
| Computers & Mathematics | 0 (0.0%) | 0 (0.0%) |
| Architecture & Engineering | 0 (0.0%) | 0 (0.0%) |
| Life, Physical & Social Science | 0 (0.0%) | 0 (0.0%) |
| Community & Social Service | 10 (66.7%) | 5 (33.3%) |
| Education, Arts & Media | 0 (0.0%) | 2 (100.0%) |
| Legal Services & Support | 0 (0.0%) | 0 (0.0%) |
| Education Instruction & Library | 10 (76.9%) | 3 (23.1%) |
| Arts, Media & Entertainment | 0 (0.0%) | 0 (0.0%) |
| Health Diagnosing & Treating | 0 (0.0%) | 28 (100.0%) |
| Health Technologists | 0 (0.0%) | 0 (0.0%) |
| Total (Category) | 12 (20.0%) | 48 (80.0%) |
| Total (Overall) | 121 (59.3%) | 83 (40.7%) |
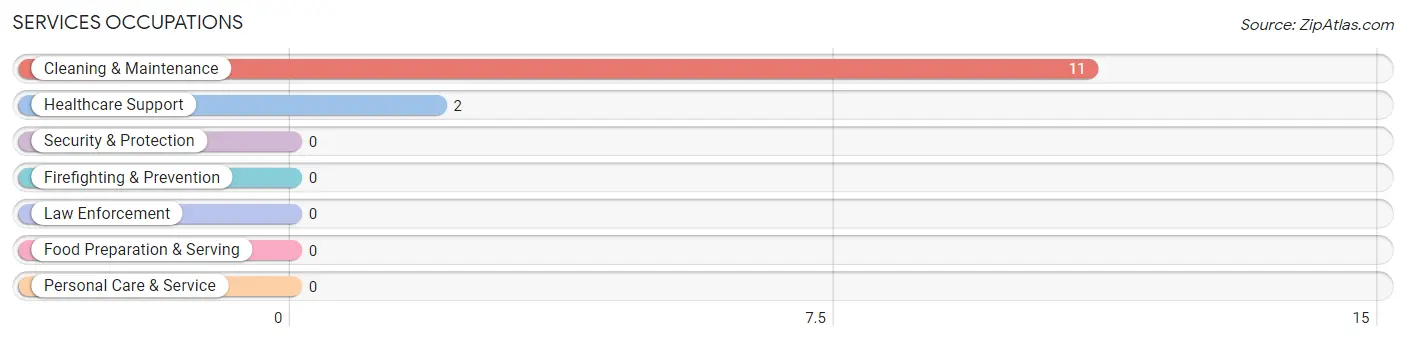
Services Occupations
The most common Services occupations in Midway are Cleaning & Maintenance (11 | 5.4%), and Healthcare Support (2 | 1.0%).
Services Occupations by Sex
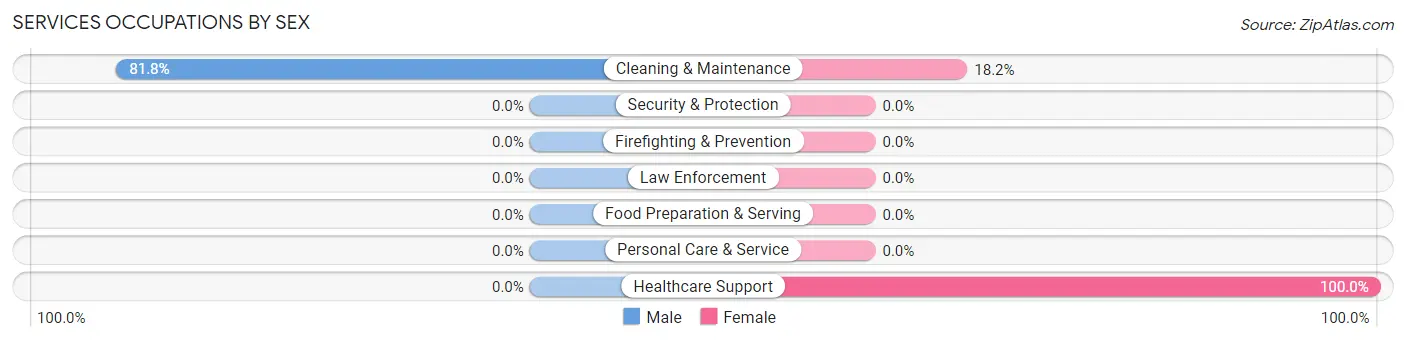
| Occupation | Male | Female |
| Healthcare Support | 0 (0.0%) | 2 (100.0%) |
| Security & Protection | 0 (0.0%) | 0 (0.0%) |
| Firefighting & Prevention | 0 (0.0%) | 0 (0.0%) |
| Law Enforcement | 0 (0.0%) | 0 (0.0%) |
| Food Preparation & Serving | 0 (0.0%) | 0 (0.0%) |
| Cleaning & Maintenance | 9 (81.8%) | 2 (18.2%) |
| Personal Care & Service | 0 (0.0%) | 0 (0.0%) |
| Total (Category) | 9 (69.2%) | 4 (30.8%) |
| Total (Overall) | 121 (59.3%) | 83 (40.7%) |
Sales and Office Occupations
The most common Sales and Office occupations in Midway are , and Office & Administration (5 | 2.5%).

Sales and Office Occupations by Sex

| Occupation | Male | Female |
| Sales & Related | 0 (0.0%) | 0 (0.0%) |
| Office & Administration | 0 (0.0%) | 5 (100.0%) |
| Total (Category) | 0 (0.0%) | 5 (100.0%) |
| Total (Overall) | 121 (59.3%) | 83 (40.7%) |
Natural Resources, Construction and Maintenance Occupations
The most common Natural Resources, Construction and Maintenance occupations in Midway are , and Installation, Maintenance & Repair (12 | 5.9%).

Natural Resources, Construction and Maintenance Occupations by Sex

| Occupation | Male | Female |
| Farming, Fishing & Forestry | 0 (0.0%) | 0 (0.0%) |
| Construction & Extraction | 0 (0.0%) | 0 (0.0%) |
| Installation, Maintenance & Repair | 12 (100.0%) | 0 (0.0%) |
| Total (Category) | 12 (100.0%) | 0 (0.0%) |
| Total (Overall) | 121 (59.3%) | 83 (40.7%) |
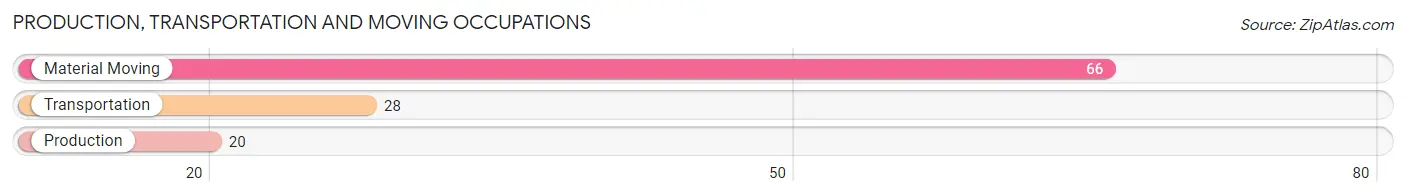
Production, Transportation and Moving Occupations
The most common Production, Transportation and Moving occupations in Midway are Material Moving (66 | 32.4%), Transportation (28 | 13.7%), and Production (20 | 9.8%).
Production, Transportation and Moving Occupations by Sex
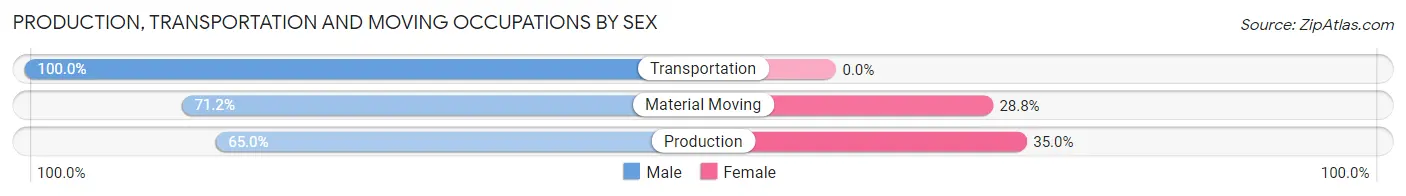
| Occupation | Male | Female |
| Production | 13 (65.0%) | 7 (35.0%) |
| Transportation | 28 (100.0%) | 0 (0.0%) |
| Material Moving | 47 (71.2%) | 19 (28.8%) |
| Total (Category) | 88 (77.2%) | 26 (22.8%) |
| Total (Overall) | 121 (59.3%) | 83 (40.7%) |
Employment Industries by Sex in Midway
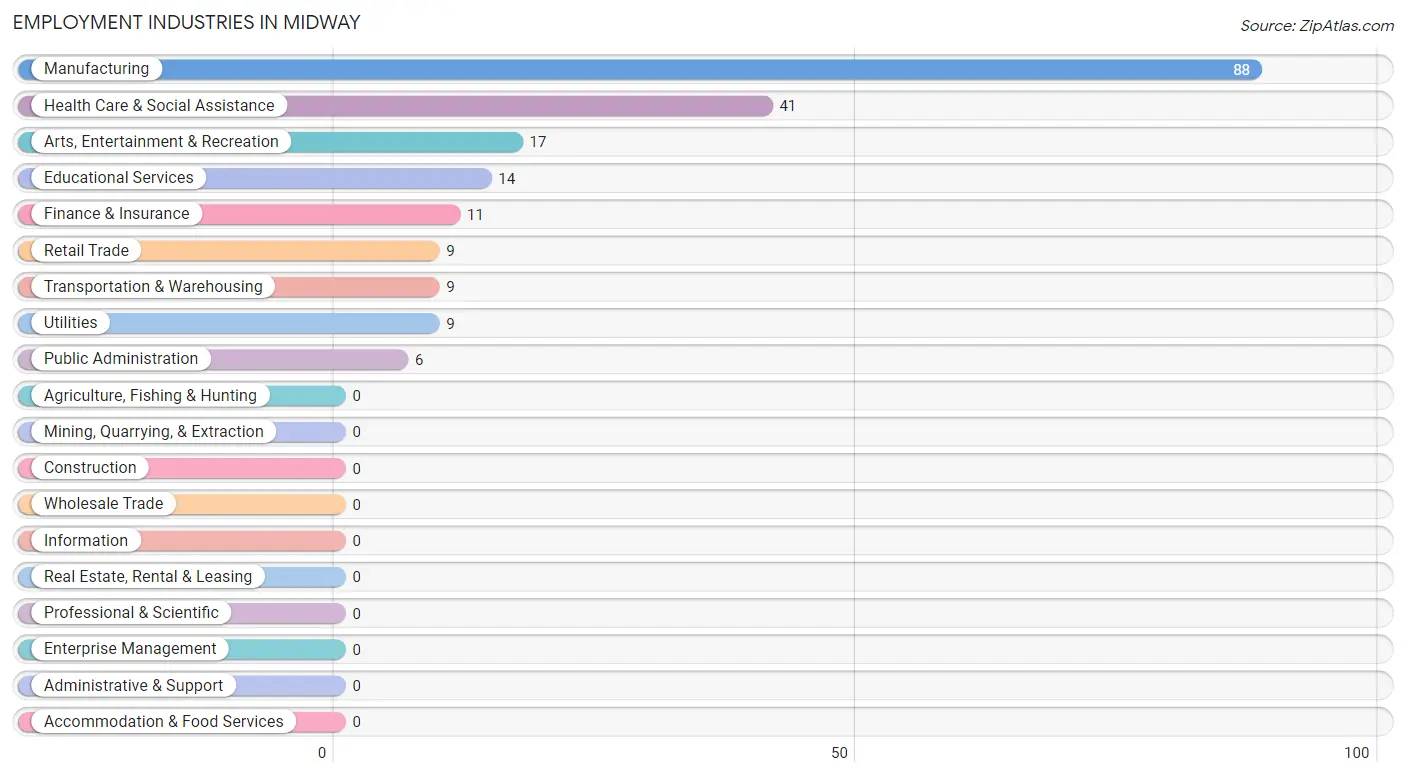
Employment Industries in Midway
The major employment industries in Midway include Manufacturing (88 | 43.1%), Health Care & Social Assistance (41 | 20.1%), Arts, Entertainment & Recreation (17 | 8.3%), Educational Services (14 | 6.9%), and Finance & Insurance (11 | 5.4%).
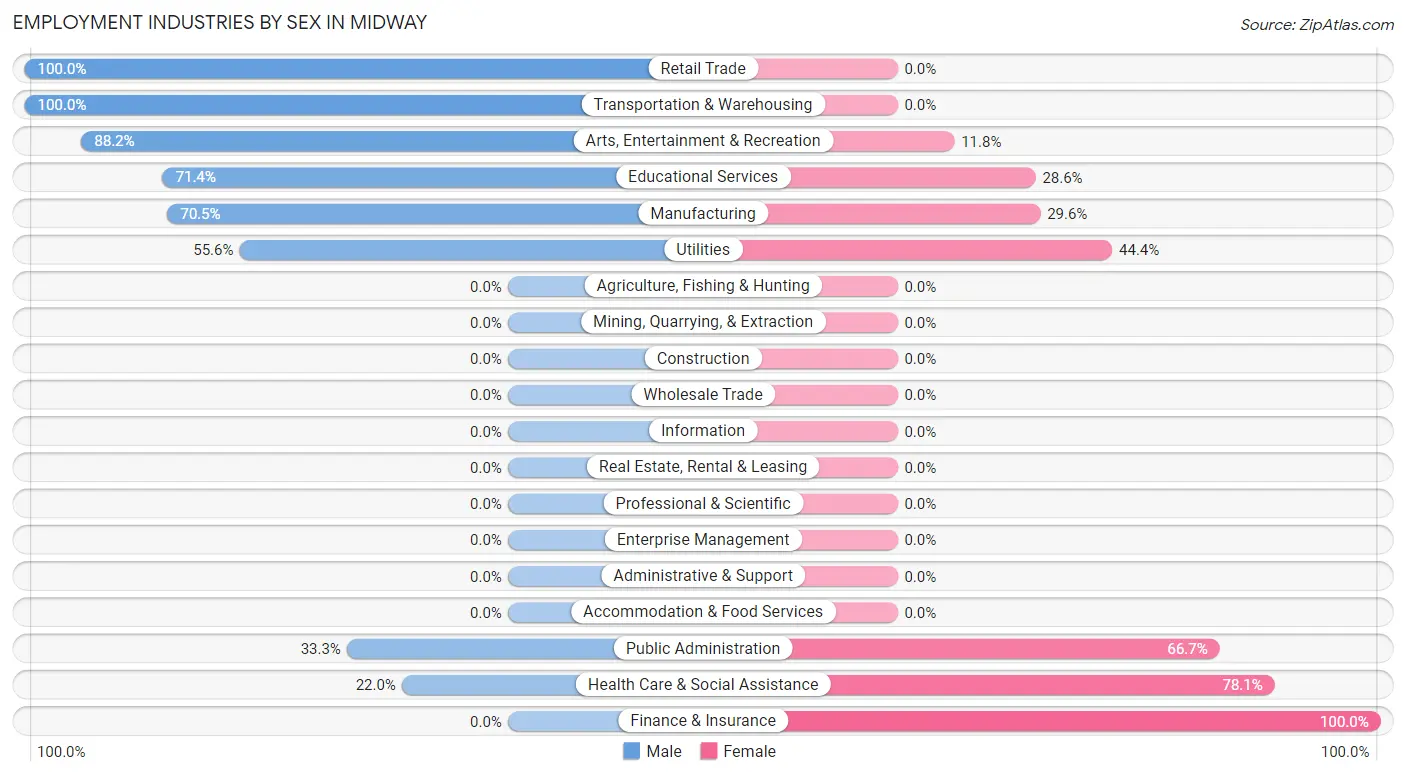
Employment Industries by Sex in Midway
The Midway industries that see more men than women are Retail Trade (100.0%), Transportation & Warehousing (100.0%), and Arts, Entertainment & Recreation (88.2%), whereas the industries that tend to have a higher number of women are Finance & Insurance (100.0%), Health Care & Social Assistance (78.0%), and Public Administration (66.7%).
| Industry | Male | Female |
| Agriculture, Fishing & Hunting | 0 (0.0%) | 0 (0.0%) |
| Mining, Quarrying, & Extraction | 0 (0.0%) | 0 (0.0%) |
| Construction | 0 (0.0%) | 0 (0.0%) |
| Manufacturing | 62 (70.5%) | 26 (29.5%) |
| Wholesale Trade | 0 (0.0%) | 0 (0.0%) |
| Retail Trade | 9 (100.0%) | 0 (0.0%) |
| Transportation & Warehousing | 9 (100.0%) | 0 (0.0%) |
| Utilities | 5 (55.6%) | 4 (44.4%) |
| Information | 0 (0.0%) | 0 (0.0%) |
| Finance & Insurance | 0 (0.0%) | 11 (100.0%) |
| Real Estate, Rental & Leasing | 0 (0.0%) | 0 (0.0%) |
| Professional & Scientific | 0 (0.0%) | 0 (0.0%) |
| Enterprise Management | 0 (0.0%) | 0 (0.0%) |
| Administrative & Support | 0 (0.0%) | 0 (0.0%) |
| Educational Services | 10 (71.4%) | 4 (28.6%) |
| Health Care & Social Assistance | 9 (22.0%) | 32 (78.0%) |
| Arts, Entertainment & Recreation | 15 (88.2%) | 2 (11.8%) |
| Accommodation & Food Services | 0 (0.0%) | 0 (0.0%) |
| Public Administration | 2 (33.3%) | 4 (66.7%) |
| Total | 121 (59.3%) | 83 (40.7%) |
Education in Midway
School Enrollment in Midway
The most common levels of schooling among the 14 students in Midway are middle school (4 | 28.6%), college / undergraduate (4 | 28.6%), and elementary school (3 | 21.4%).
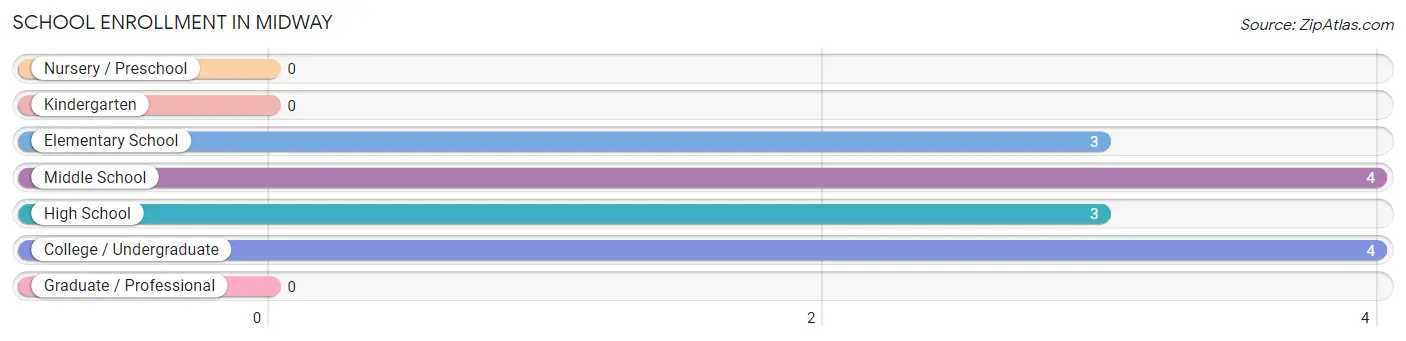
| School Level | # Students | % Students |
| Nursery / Preschool | 0 | 0.0% |
| Kindergarten | 0 | 0.0% |
| Elementary School | 3 | 21.4% |
| Middle School | 4 | 28.6% |
| High School | 3 | 21.4% |
| College / Undergraduate | 4 | 28.6% |
| Graduate / Professional | 0 | 0.0% |
| Total | 14 | 100.0% |
School Enrollment by Age by Funding Source in Midway
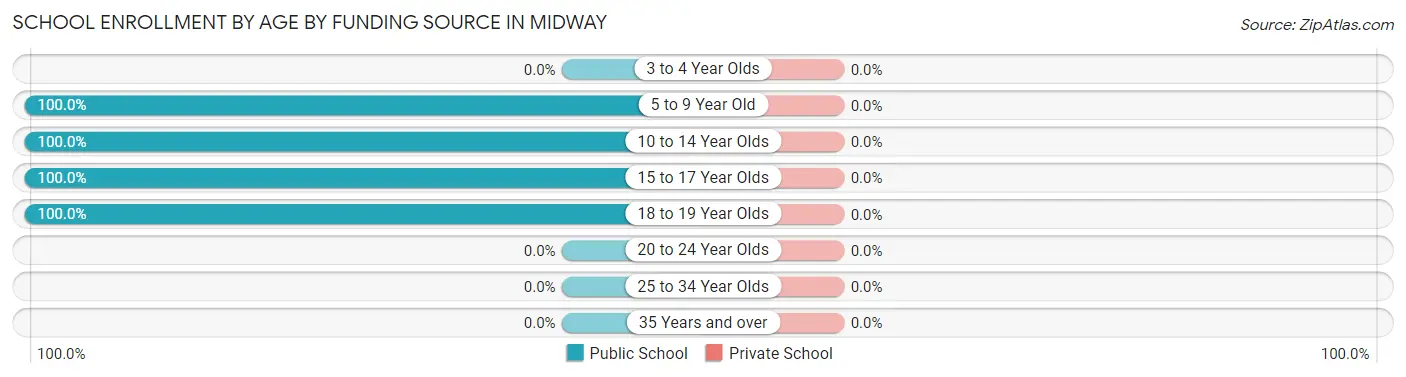
| Age Bracket | Public School | Private School |
| 3 to 4 Year Olds | 0 (0.0%) | 0 (0.0%) |
| 5 to 9 Year Old | 3 (100.0%) | 0 (0.0%) |
| 10 to 14 Year Olds | 4 (100.0%) | 0 (0.0%) |
| 15 to 17 Year Olds | 3 (100.0%) | 0 (0.0%) |
| 18 to 19 Year Olds | 4 (100.0%) | 0 (0.0%) |
| 20 to 24 Year Olds | 0 (0.0%) | 0 (0.0%) |
| 25 to 34 Year Olds | 0 (0.0%) | 0 (0.0%) |
| 35 Years and over | 0 (0.0%) | 0 (0.0%) |
| Total | 14 (100.0%) | 0 (0.0%) |
Educational Attainment by Field of Study in Midway
Education (16 | 50.0%), engineering (10 | 31.2%), business (4 | 12.5%), science & technology (1 | 3.1%), and arts & humanities (1 | 3.1%) are the most common fields of study among 32 individuals in Midway who have obtained a bachelor's degree or higher.
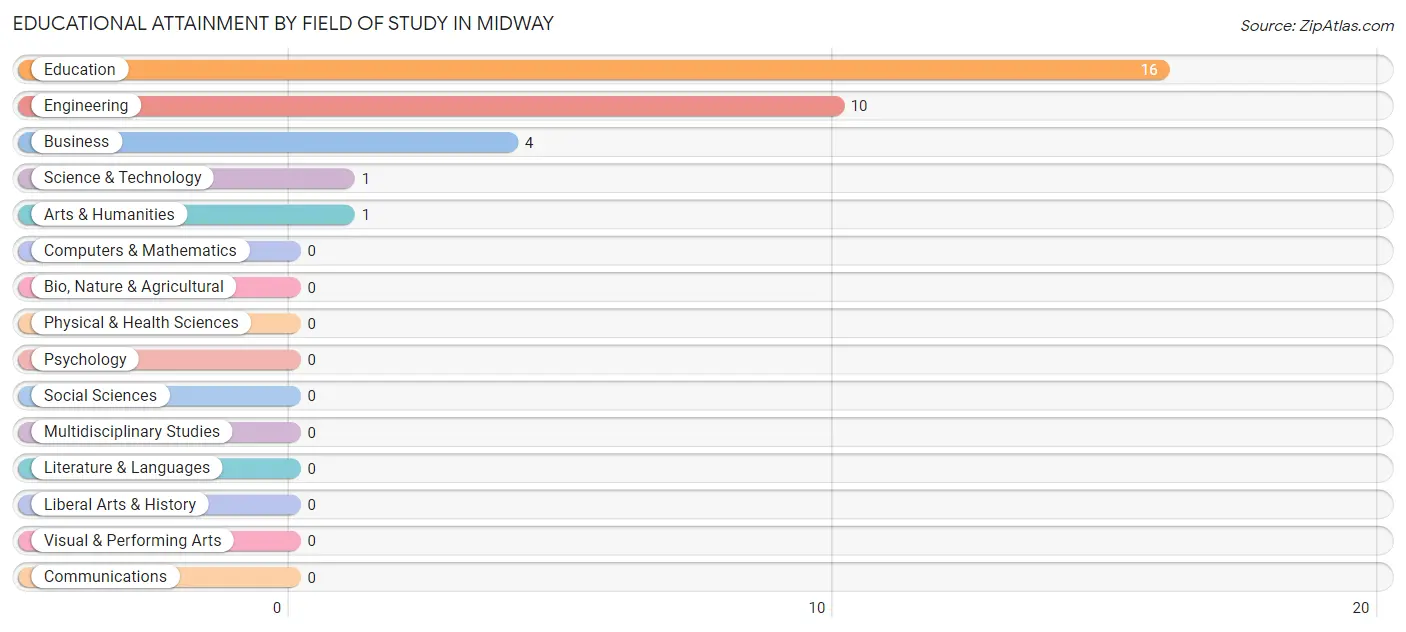
| Field of Study | # Graduates | % Graduates |
| Computers & Mathematics | 0 | 0.0% |
| Bio, Nature & Agricultural | 0 | 0.0% |
| Physical & Health Sciences | 0 | 0.0% |
| Psychology | 0 | 0.0% |
| Social Sciences | 0 | 0.0% |
| Engineering | 10 | 31.2% |
| Multidisciplinary Studies | 0 | 0.0% |
| Science & Technology | 1 | 3.1% |
| Business | 4 | 12.5% |
| Education | 16 | 50.0% |
| Literature & Languages | 0 | 0.0% |
| Liberal Arts & History | 0 | 0.0% |
| Visual & Performing Arts | 0 | 0.0% |
| Communications | 0 | 0.0% |
| Arts & Humanities | 1 | 3.1% |
| Total | 32 | 100.0% |
Transportation & Commute in Midway
Vehicle Availability by Sex in Midway
The most prevalent vehicle ownership categories in Midway are males with 1 vehicle (52, accounting for 54.2%) and females with 1 vehicle (34, making up 62.6%).
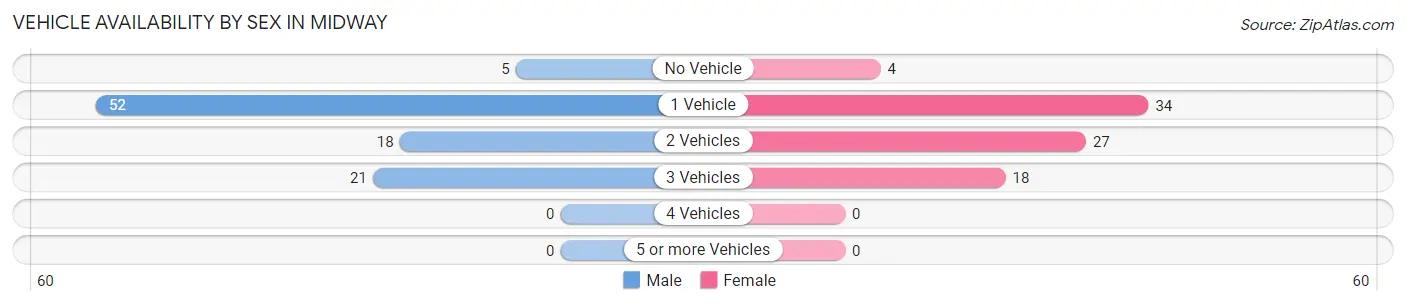
| Vehicles Available | Male | Female |
| No Vehicle | 5 (5.2%) | 4 (4.8%) |
| 1 Vehicle | 52 (54.2%) | 34 (41.0%) |
| 2 Vehicles | 18 (18.8%) | 27 (32.5%) |
| 3 Vehicles | 21 (21.9%) | 18 (21.7%) |
| 4 Vehicles | 0 (0.0%) | 0 (0.0%) |
| 5 or more Vehicles | 0 (0.0%) | 0 (0.0%) |
| Total | 96 (100.0%) | 83 (100.0%) |
Commute Time in Midway
The most frequently occuring commute durations in Midway are 20 to 24 minutes (61 commuters, 34.1%), 10 to 14 minutes (43 commuters, 24.0%), and 15 to 19 minutes (24 commuters, 13.4%).
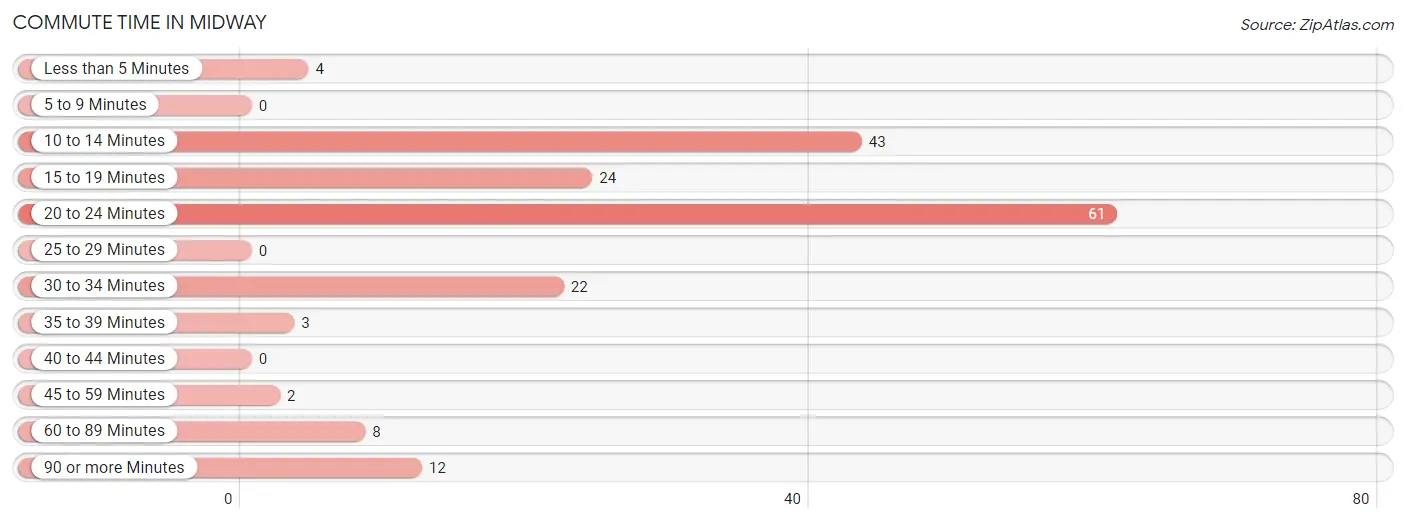
| Commute Time | # Commuters | % Commuters |
| Less than 5 Minutes | 4 | 2.2% |
| 5 to 9 Minutes | 0 | 0.0% |
| 10 to 14 Minutes | 43 | 24.0% |
| 15 to 19 Minutes | 24 | 13.4% |
| 20 to 24 Minutes | 61 | 34.1% |
| 25 to 29 Minutes | 0 | 0.0% |
| 30 to 34 Minutes | 22 | 12.3% |
| 35 to 39 Minutes | 3 | 1.7% |
| 40 to 44 Minutes | 0 | 0.0% |
| 45 to 59 Minutes | 2 | 1.1% |
| 60 to 89 Minutes | 8 | 4.5% |
| 90 or more Minutes | 12 | 6.7% |
Commute Time by Sex in Midway
The most common commute times in Midway are 10 to 14 minutes (43 commuters, 44.8%) for males and 20 to 24 minutes (39 commuters, 47.0%) for females.
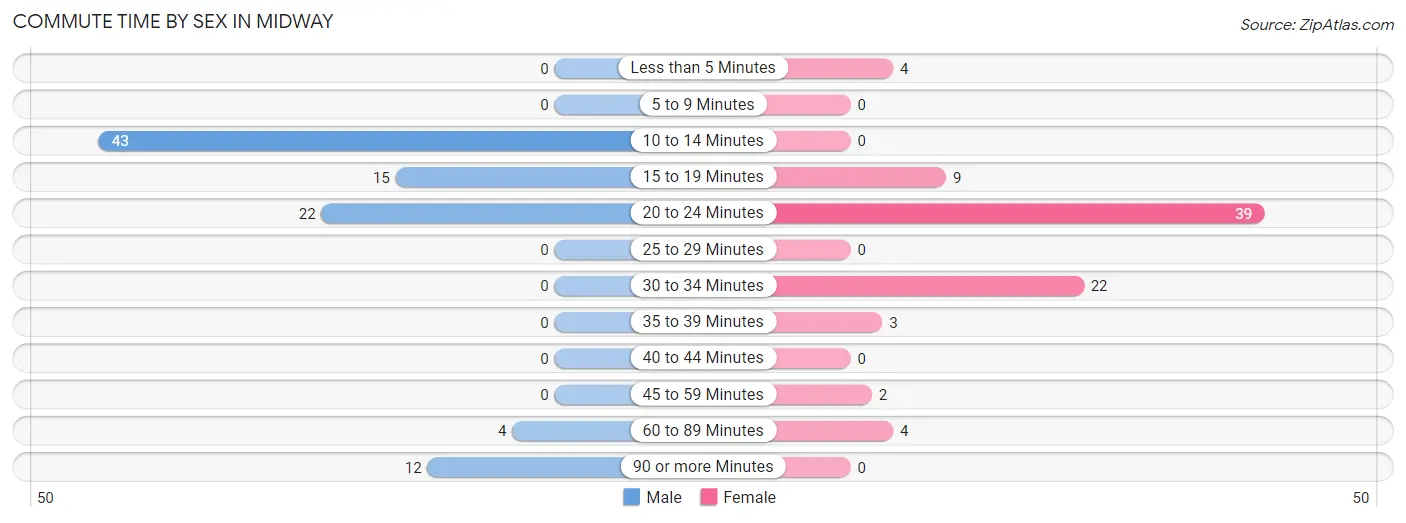
| Commute Time | Male | Female |
| Less than 5 Minutes | 0 (0.0%) | 4 (4.8%) |
| 5 to 9 Minutes | 0 (0.0%) | 0 (0.0%) |
| 10 to 14 Minutes | 43 (44.8%) | 0 (0.0%) |
| 15 to 19 Minutes | 15 (15.6%) | 9 (10.8%) |
| 20 to 24 Minutes | 22 (22.9%) | 39 (47.0%) |
| 25 to 29 Minutes | 0 (0.0%) | 0 (0.0%) |
| 30 to 34 Minutes | 0 (0.0%) | 22 (26.5%) |
| 35 to 39 Minutes | 0 (0.0%) | 3 (3.6%) |
| 40 to 44 Minutes | 0 (0.0%) | 0 (0.0%) |
| 45 to 59 Minutes | 0 (0.0%) | 2 (2.4%) |
| 60 to 89 Minutes | 4 (4.2%) | 4 (4.8%) |
| 90 or more Minutes | 12 (12.5%) | 0 (0.0%) |
Time of Departure to Work by Sex in Midway
The most frequent times of departure to work in Midway are 4:00 PM to 11:59 PM (27, 28.1%) for males and 7:00 AM to 7:29 AM (33, 39.8%) for females.
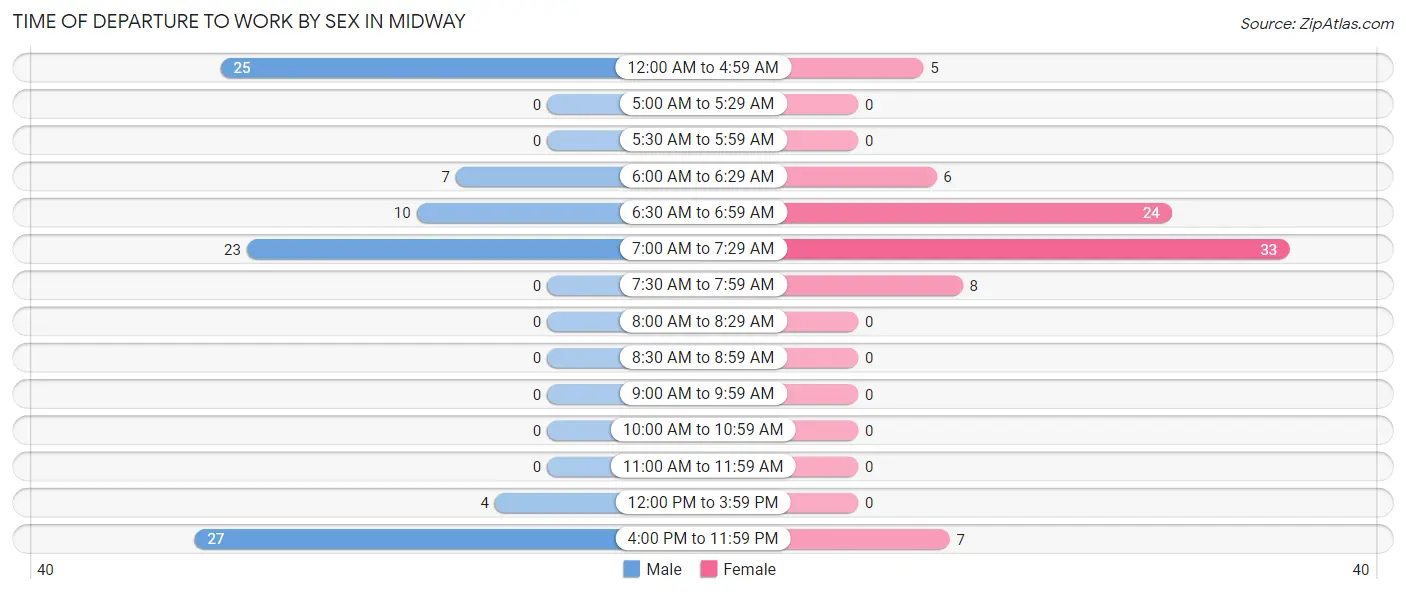
| Time of Departure | Male | Female |
| 12:00 AM to 4:59 AM | 25 (26.0%) | 5 (6.0%) |
| 5:00 AM to 5:29 AM | 0 (0.0%) | 0 (0.0%) |
| 5:30 AM to 5:59 AM | 0 (0.0%) | 0 (0.0%) |
| 6:00 AM to 6:29 AM | 7 (7.3%) | 6 (7.2%) |
| 6:30 AM to 6:59 AM | 10 (10.4%) | 24 (28.9%) |
| 7:00 AM to 7:29 AM | 23 (24.0%) | 33 (39.8%) |
| 7:30 AM to 7:59 AM | 0 (0.0%) | 8 (9.6%) |
| 8:00 AM to 8:29 AM | 0 (0.0%) | 0 (0.0%) |
| 8:30 AM to 8:59 AM | 0 (0.0%) | 0 (0.0%) |
| 9:00 AM to 9:59 AM | 0 (0.0%) | 0 (0.0%) |
| 10:00 AM to 10:59 AM | 0 (0.0%) | 0 (0.0%) |
| 11:00 AM to 11:59 AM | 0 (0.0%) | 0 (0.0%) |
| 12:00 PM to 3:59 PM | 4 (4.2%) | 0 (0.0%) |
| 4:00 PM to 11:59 PM | 27 (28.1%) | 7 (8.4%) |
| Total | 96 (100.0%) | 83 (100.0%) |
Housing Occupancy in Midway
Occupancy by Ownership in Midway
Of the total 234 dwellings in Midway, owner-occupied units account for 137 (58.6%), while renter-occupied units make up 97 (41.4%).
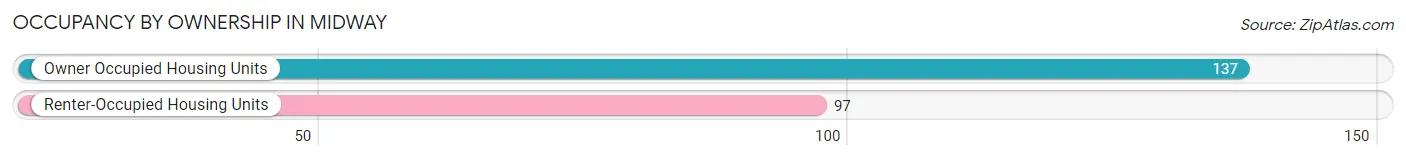
| Occupancy | # Housing Units | % Housing Units |
| Owner Occupied Housing Units | 137 | 58.6% |
| Renter-Occupied Housing Units | 97 | 41.4% |
| Total Occupied Housing Units | 234 | 100.0% |
Occupancy by Household Size in Midway
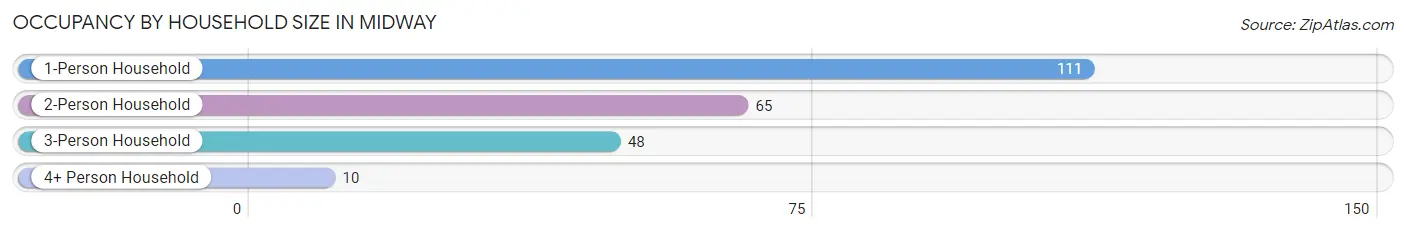
| Household Size | # Housing Units | % Housing Units |
| 1-Person Household | 111 | 47.4% |
| 2-Person Household | 65 | 27.8% |
| 3-Person Household | 48 | 20.5% |
| 4+ Person Household | 10 | 4.3% |
| Total Housing Units | 234 | 100.0% |
Occupancy by Ownership by Household Size in Midway
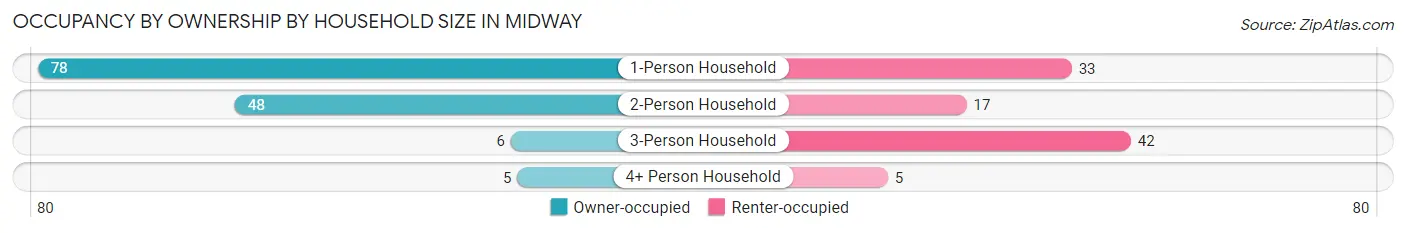
| Household Size | Owner-occupied | Renter-occupied |
| 1-Person Household | 78 (70.3%) | 33 (29.7%) |
| 2-Person Household | 48 (73.9%) | 17 (26.2%) |
| 3-Person Household | 6 (12.5%) | 42 (87.5%) |
| 4+ Person Household | 5 (50.0%) | 5 (50.0%) |
| Total Housing Units | 137 (58.6%) | 97 (41.4%) |
Occupancy by Educational Attainment in Midway
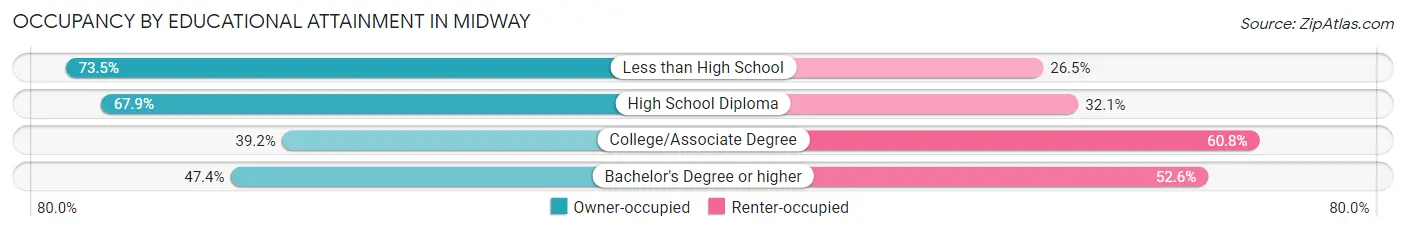
| Household Size | Owner-occupied | Renter-occupied |
| Less than High School | 61 (73.5%) | 22 (26.5%) |
| High School Diploma | 36 (67.9%) | 17 (32.1%) |
| College/Associate Degree | 31 (39.2%) | 48 (60.8%) |
| Bachelor's Degree or higher | 9 (47.4%) | 10 (52.6%) |
Occupancy by Age of Householder in Midway
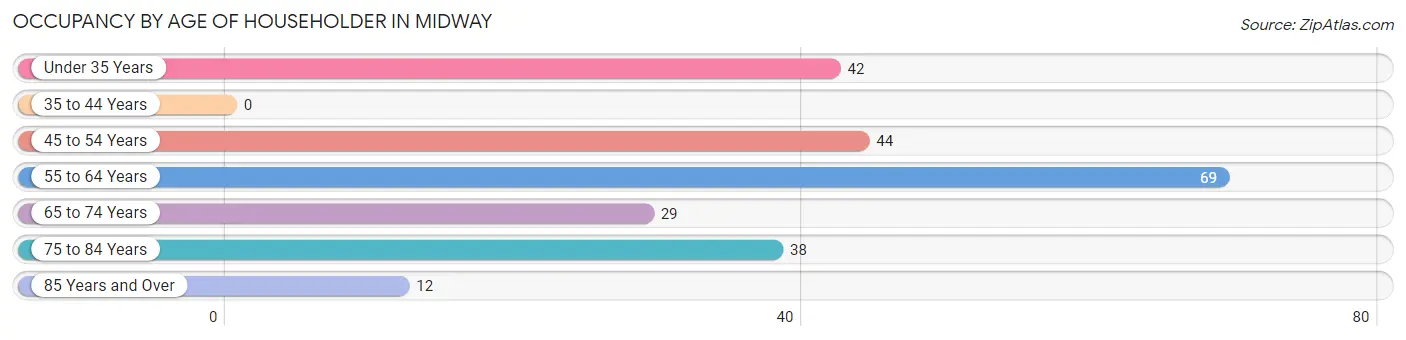
| Age Bracket | # Households | % Households |
| Under 35 Years | 42 | 17.9% |
| 35 to 44 Years | 0 | 0.0% |
| 45 to 54 Years | 44 | 18.8% |
| 55 to 64 Years | 69 | 29.5% |
| 65 to 74 Years | 29 | 12.4% |
| 75 to 84 Years | 38 | 16.2% |
| 85 Years and Over | 12 | 5.1% |
| Total | 234 | 100.0% |
Housing Finances in Midway
Median Income by Occupancy in Midway
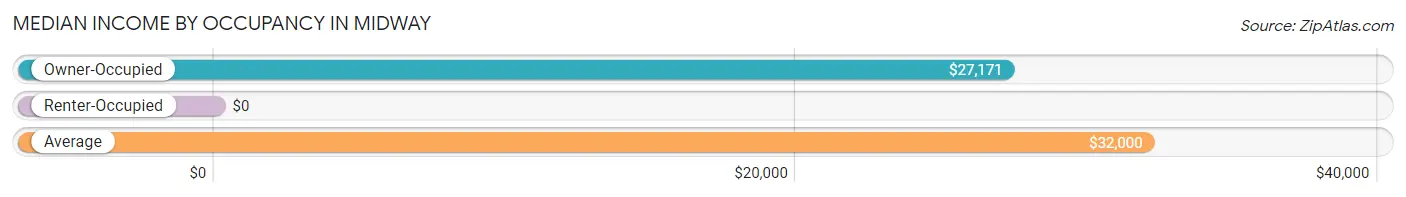
| Occupancy Type | # Households | Median Income |
| Owner-Occupied | 137 (58.6%) | $27,171 |
| Renter-Occupied | 97 (41.4%) | $0 |
| Average | 234 (100.0%) | $32,000 |
Occupancy by Householder Income Bracket in Midway
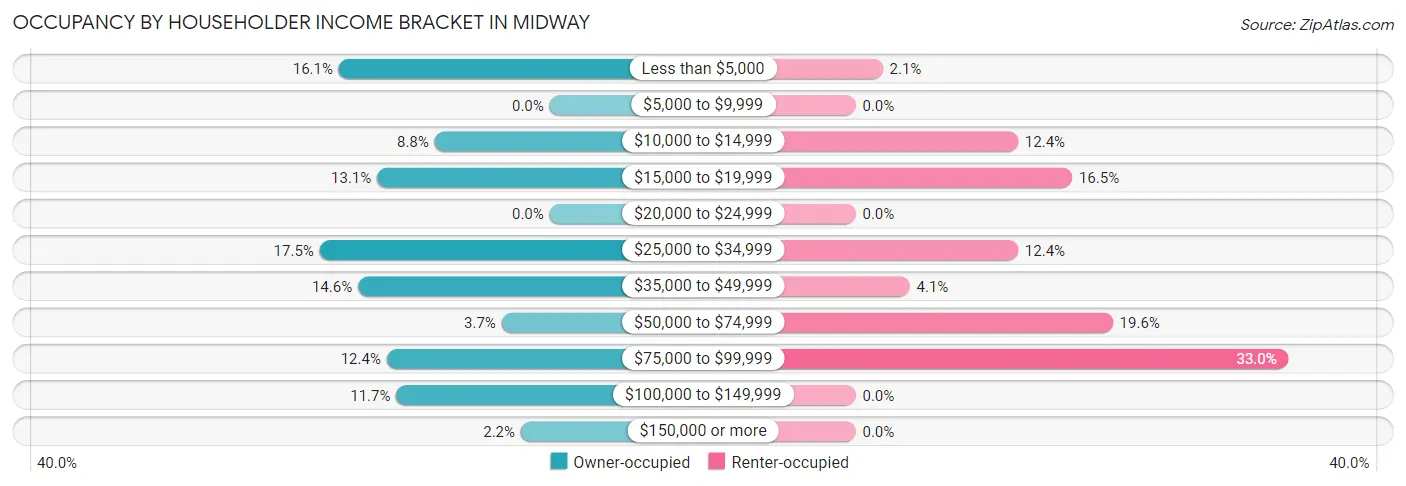
| Income Bracket | Owner-occupied | Renter-occupied |
| Less than $5,000 | 22 (16.1%) | 2 (2.1%) |
| $5,000 to $9,999 | 0 (0.0%) | 0 (0.0%) |
| $10,000 to $14,999 | 12 (8.8%) | 12 (12.4%) |
| $15,000 to $19,999 | 18 (13.1%) | 16 (16.5%) |
| $20,000 to $24,999 | 0 (0.0%) | 0 (0.0%) |
| $25,000 to $34,999 | 24 (17.5%) | 12 (12.4%) |
| $35,000 to $49,999 | 20 (14.6%) | 4 (4.1%) |
| $50,000 to $74,999 | 5 (3.6%) | 19 (19.6%) |
| $75,000 to $99,999 | 17 (12.4%) | 32 (33.0%) |
| $100,000 to $149,999 | 16 (11.7%) | 0 (0.0%) |
| $150,000 or more | 3 (2.2%) | 0 (0.0%) |
| Total | 137 (100.0%) | 97 (100.0%) |
Monthly Housing Cost Tiers in Midway
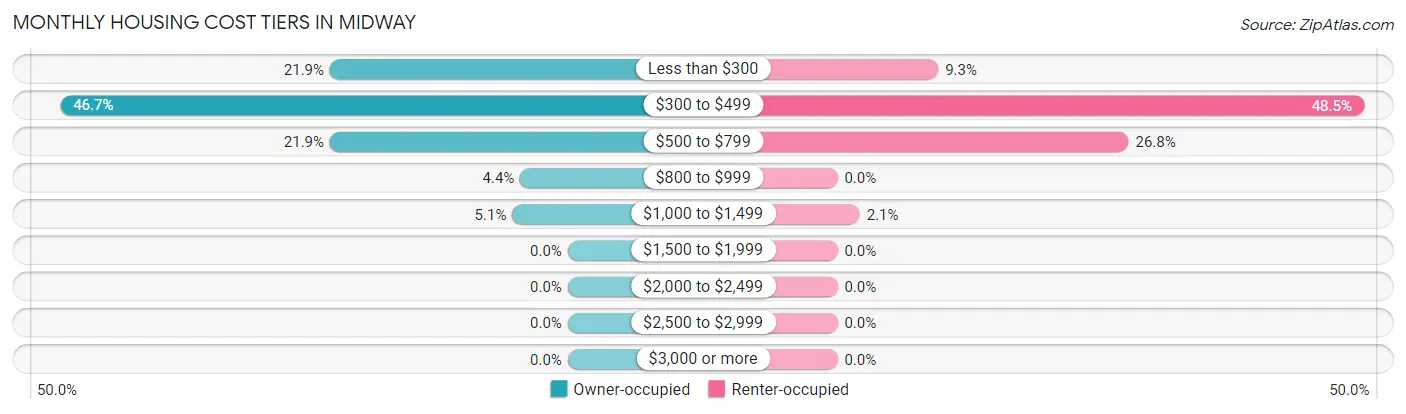
| Monthly Cost | Owner-occupied | Renter-occupied |
| Less than $300 | 30 (21.9%) | 9 (9.3%) |
| $300 to $499 | 64 (46.7%) | 47 (48.4%) |
| $500 to $799 | 30 (21.9%) | 26 (26.8%) |
| $800 to $999 | 6 (4.4%) | 0 (0.0%) |
| $1,000 to $1,499 | 7 (5.1%) | 2 (2.1%) |
| $1,500 to $1,999 | 0 (0.0%) | 0 (0.0%) |
| $2,000 to $2,499 | 0 (0.0%) | 0 (0.0%) |
| $2,500 to $2,999 | 0 (0.0%) | 0 (0.0%) |
| $3,000 or more | 0 (0.0%) | 0 (0.0%) |
| Total | 137 (100.0%) | 97 (100.0%) |
Physical Housing Characteristics in Midway
Housing Structures in Midway
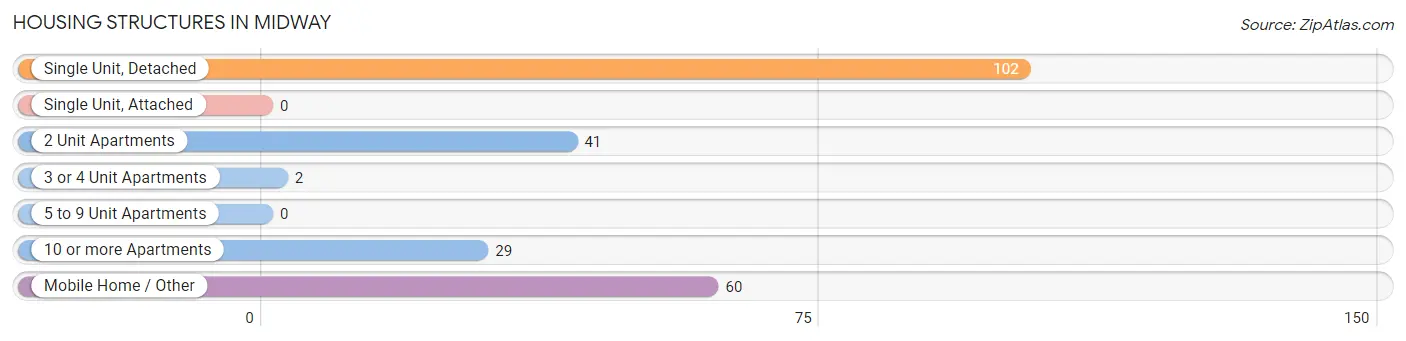
| Structure Type | # Housing Units | % Housing Units |
| Single Unit, Detached | 102 | 43.6% |
| Single Unit, Attached | 0 | 0.0% |
| 2 Unit Apartments | 41 | 17.5% |
| 3 or 4 Unit Apartments | 2 | 0.9% |
| 5 to 9 Unit Apartments | 0 | 0.0% |
| 10 or more Apartments | 29 | 12.4% |
| Mobile Home / Other | 60 | 25.6% |
| Total | 234 | 100.0% |
Housing Structures by Occupancy in Midway
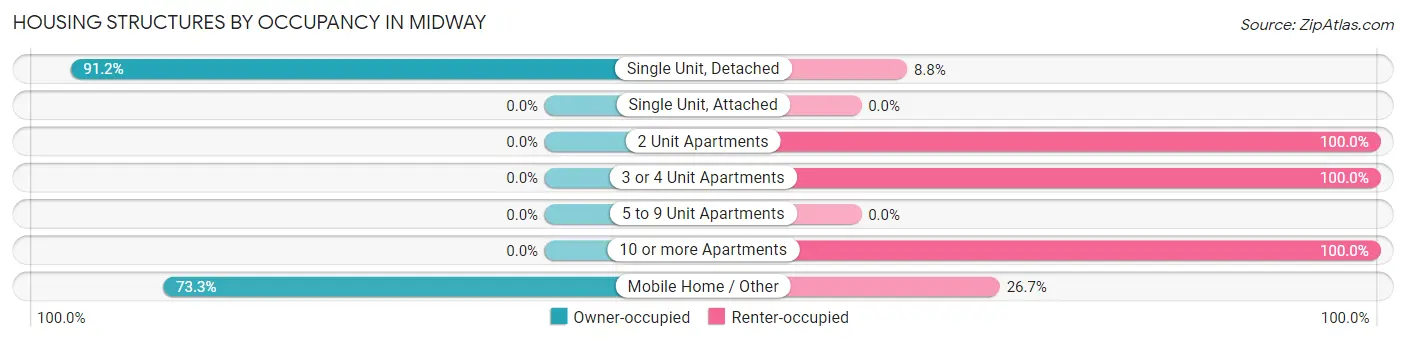
| Structure Type | Owner-occupied | Renter-occupied |
| Single Unit, Detached | 93 (91.2%) | 9 (8.8%) |
| Single Unit, Attached | 0 (0.0%) | 0 (0.0%) |
| 2 Unit Apartments | 0 (0.0%) | 41 (100.0%) |
| 3 or 4 Unit Apartments | 0 (0.0%) | 2 (100.0%) |
| 5 to 9 Unit Apartments | 0 (0.0%) | 0 (0.0%) |
| 10 or more Apartments | 0 (0.0%) | 29 (100.0%) |
| Mobile Home / Other | 44 (73.3%) | 16 (26.7%) |
| Total | 137 (58.6%) | 97 (41.4%) |
Housing Structures by Number of Rooms in Midway
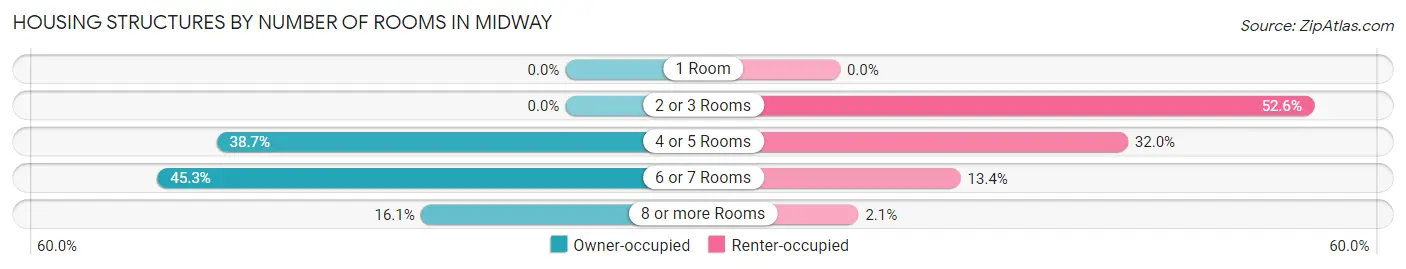
| Number of Rooms | Owner-occupied | Renter-occupied |
| 1 Room | 0 (0.0%) | 0 (0.0%) |
| 2 or 3 Rooms | 0 (0.0%) | 51 (52.6%) |
| 4 or 5 Rooms | 53 (38.7%) | 31 (32.0%) |
| 6 or 7 Rooms | 62 (45.3%) | 13 (13.4%) |
| 8 or more Rooms | 22 (16.1%) | 2 (2.1%) |
| Total | 137 (100.0%) | 97 (100.0%) |
Housing Structure by Heating Type in Midway
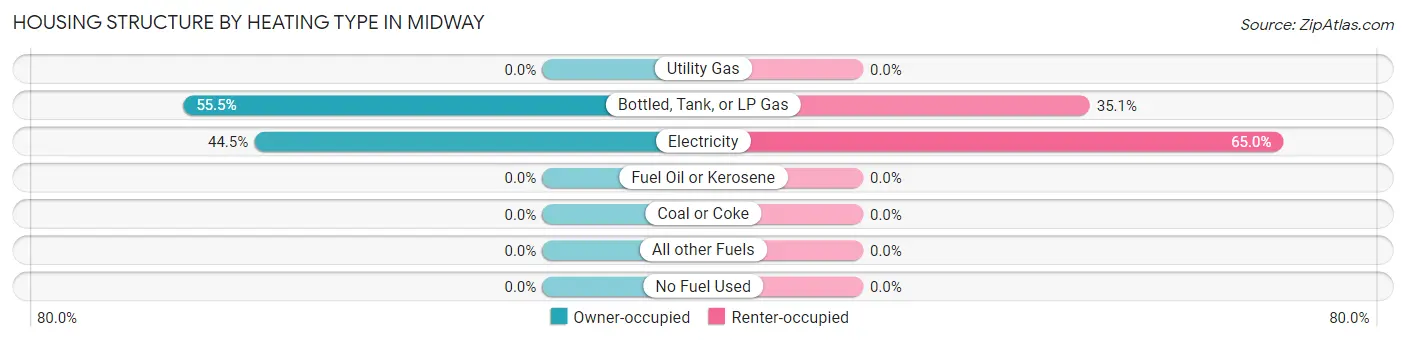
| Heating Type | Owner-occupied | Renter-occupied |
| Utility Gas | 0 (0.0%) | 0 (0.0%) |
| Bottled, Tank, or LP Gas | 76 (55.5%) | 34 (35.0%) |
| Electricity | 61 (44.5%) | 63 (64.9%) |
| Fuel Oil or Kerosene | 0 (0.0%) | 0 (0.0%) |
| Coal or Coke | 0 (0.0%) | 0 (0.0%) |
| All other Fuels | 0 (0.0%) | 0 (0.0%) |
| No Fuel Used | 0 (0.0%) | 0 (0.0%) |
| Total | 137 (100.0%) | 97 (100.0%) |
Household Vehicle Usage in Midway
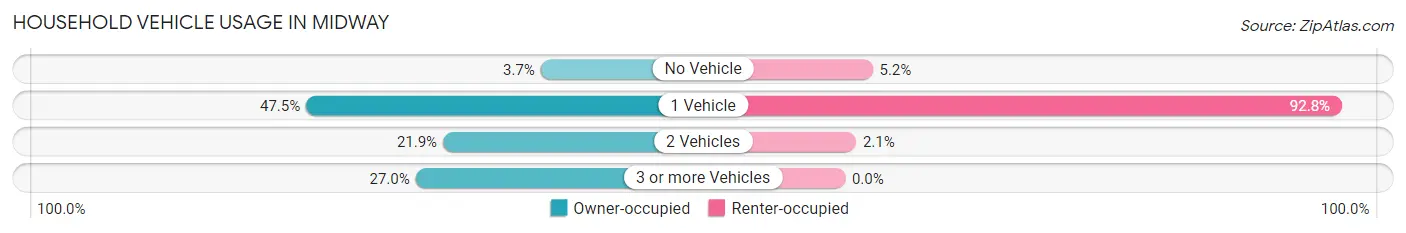
| Vehicles per Household | Owner-occupied | Renter-occupied |
| No Vehicle | 5 (3.6%) | 5 (5.1%) |
| 1 Vehicle | 65 (47.4%) | 90 (92.8%) |
| 2 Vehicles | 30 (21.9%) | 2 (2.1%) |
| 3 or more Vehicles | 37 (27.0%) | 0 (0.0%) |
| Total | 137 (100.0%) | 97 (100.0%) |
Real Estate & Mortgages in Midway
Real Estate and Mortgage Overview in Midway
| Characteristic | Without Mortgage | With Mortgage |
| Housing Units | 125 | 12 |
| Median Property Value | $115,600 | $0 |
| Median Household Income | $26,776 | $3 |
| Monthly Housing Costs | $402 | $0 |
| Real Estate Taxes | $218 | $0 |
Property Value by Mortgage Status in Midway
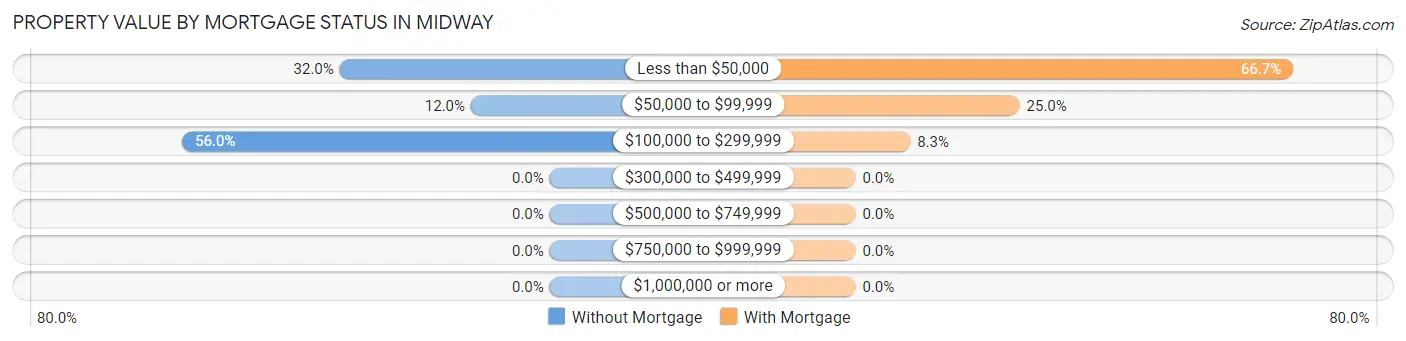
| Property Value | Without Mortgage | With Mortgage |
| Less than $50,000 | 40 (32.0%) | 8 (66.7%) |
| $50,000 to $99,999 | 15 (12.0%) | 3 (25.0%) |
| $100,000 to $299,999 | 70 (56.0%) | 1 (8.3%) |
| $300,000 to $499,999 | 0 (0.0%) | 0 (0.0%) |
| $500,000 to $749,999 | 0 (0.0%) | 0 (0.0%) |
| $750,000 to $999,999 | 0 (0.0%) | 0 (0.0%) |
| $1,000,000 or more | 0 (0.0%) | 0 (0.0%) |
| Total | 125 (100.0%) | 12 (100.0%) |
Household Income by Mortgage Status in Midway
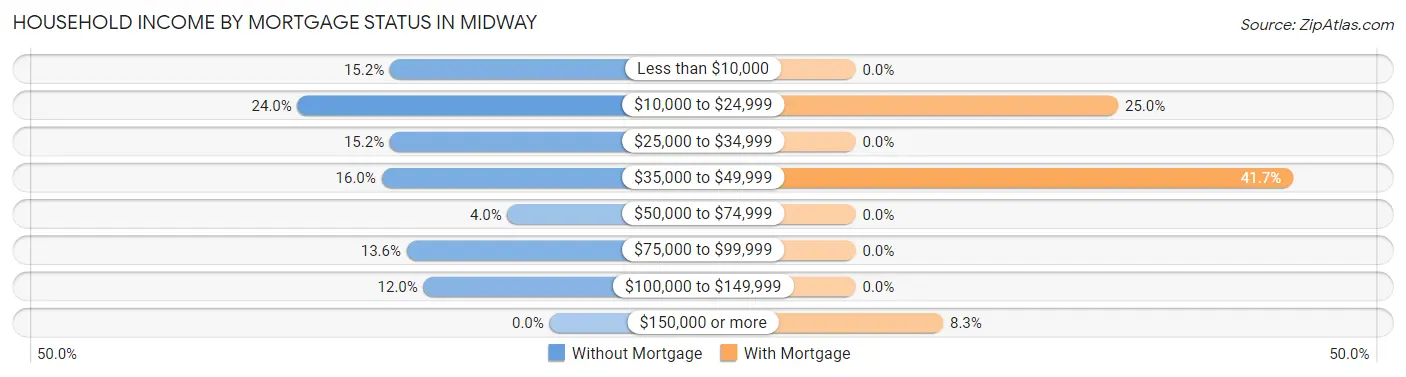
| Household Income | Without Mortgage | With Mortgage |
| Less than $10,000 | 19 (15.2%) | 0 (0.0%) |
| $10,000 to $24,999 | 30 (24.0%) | 3 (25.0%) |
| $25,000 to $34,999 | 19 (15.2%) | 0 (0.0%) |
| $35,000 to $49,999 | 20 (16.0%) | 5 (41.7%) |
| $50,000 to $74,999 | 5 (4.0%) | 0 (0.0%) |
| $75,000 to $99,999 | 17 (13.6%) | 0 (0.0%) |
| $100,000 to $149,999 | 15 (12.0%) | 0 (0.0%) |
| $150,000 or more | 0 (0.0%) | 1 (8.3%) |
| Total | 125 (100.0%) | 12 (100.0%) |
Property Value to Household Income Ratio in Midway
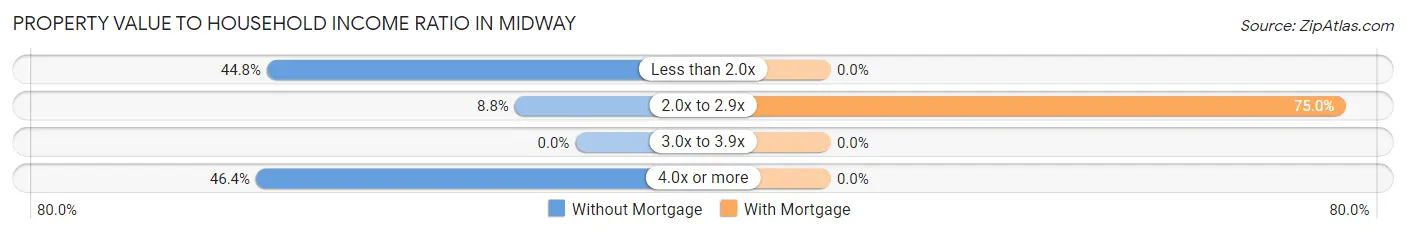
| Value-to-Income Ratio | Without Mortgage | With Mortgage |
| Less than 2.0x | 56 (44.8%) | 0 (0.0%) |
| 2.0x to 2.9x | 11 (8.8%) | 9 (75.0%) |
| 3.0x to 3.9x | 0 (0.0%) | 0 (0.0%) |
| 4.0x or more | 58 (46.4%) | 0 (0.0%) |
| Total | 125 (100.0%) | 12 (100.0%) |
Real Estate Taxes by Mortgage Status in Midway
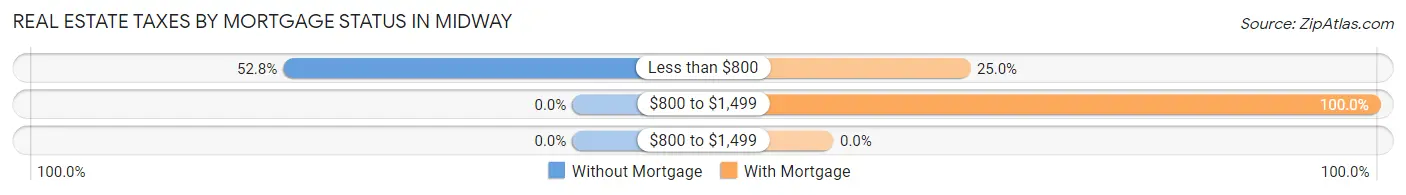
| Property Taxes | Without Mortgage | With Mortgage |
| Less than $800 | 66 (52.8%) | 3 (25.0%) |
| $800 to $1,499 | 0 (0.0%) | 12 (100.0%) |
| $800 to $1,499 | 0 (0.0%) | 0 (0.0%) |
| Total | 125 (100.0%) | 12 (100.0%) |
Health & Disability in Midway
Health Insurance Coverage by Age in Midway
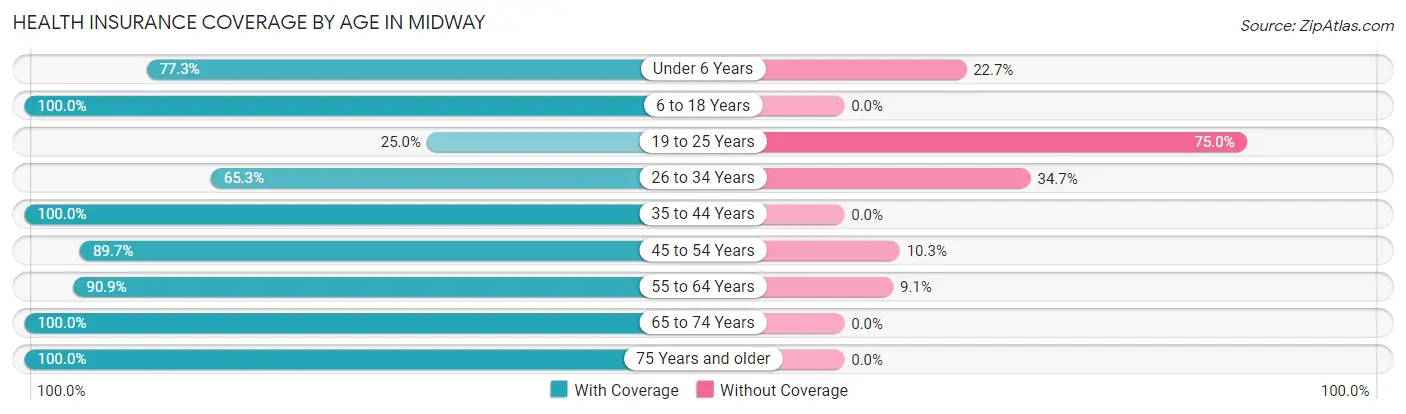
| Age Bracket | With Coverage | Without Coverage |
| Under 6 Years | 34 (77.3%) | 10 (22.7%) |
| 6 to 18 Years | 10 (100.0%) | 0 (0.0%) |
| 19 to 25 Years | 3 (25.0%) | 9 (75.0%) |
| 26 to 34 Years | 109 (65.3%) | 58 (34.7%) |
| 35 to 44 Years | 9 (100.0%) | 0 (0.0%) |
| 45 to 54 Years | 78 (89.7%) | 9 (10.3%) |
| 55 to 64 Years | 80 (90.9%) | 8 (9.1%) |
| 65 to 74 Years | 40 (100.0%) | 0 (0.0%) |
| 75 Years and older | 50 (100.0%) | 0 (0.0%) |
| Total | 413 (81.5%) | 94 (18.5%) |
Health Insurance Coverage by Citizenship Status in Midway
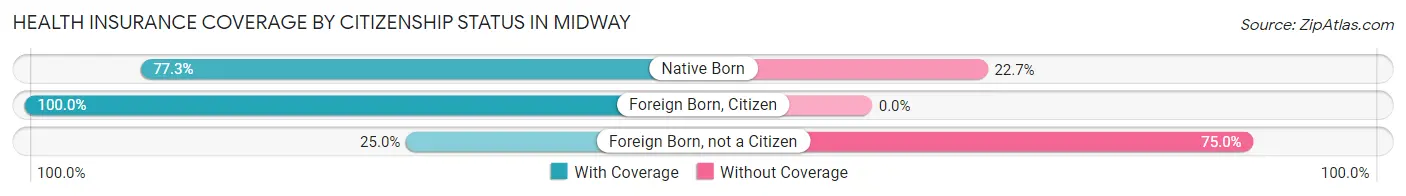
| Citizenship Status | With Coverage | Without Coverage |
| Native Born | 34 (77.3%) | 10 (22.7%) |
| Foreign Born, Citizen | 10 (100.0%) | 0 (0.0%) |
| Foreign Born, not a Citizen | 3 (25.0%) | 9 (75.0%) |
Health Insurance Coverage by Household Income in Midway
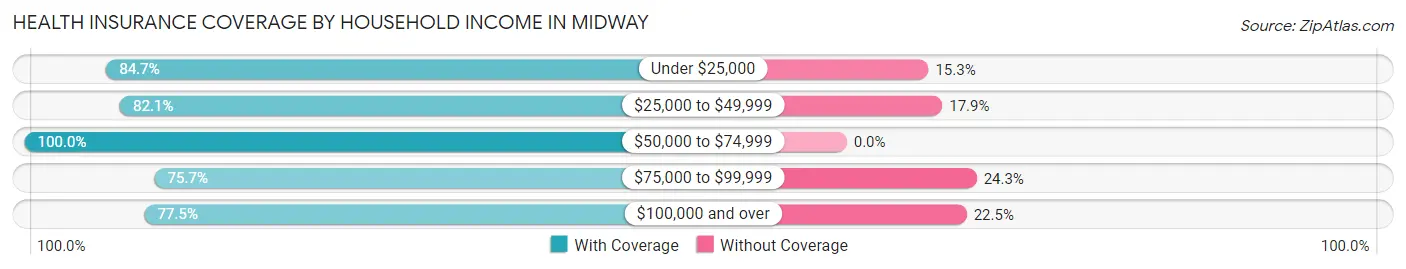
| Household Income | With Coverage | Without Coverage |
| Under $25,000 | 83 (84.7%) | 15 (15.3%) |
| $25,000 to $49,999 | 101 (82.1%) | 22 (17.9%) |
| $50,000 to $74,999 | 45 (100.0%) | 0 (0.0%) |
| $75,000 to $99,999 | 115 (75.7%) | 37 (24.3%) |
| $100,000 and over | 69 (77.5%) | 20 (22.5%) |
Public vs Private Health Insurance Coverage by Age in Midway
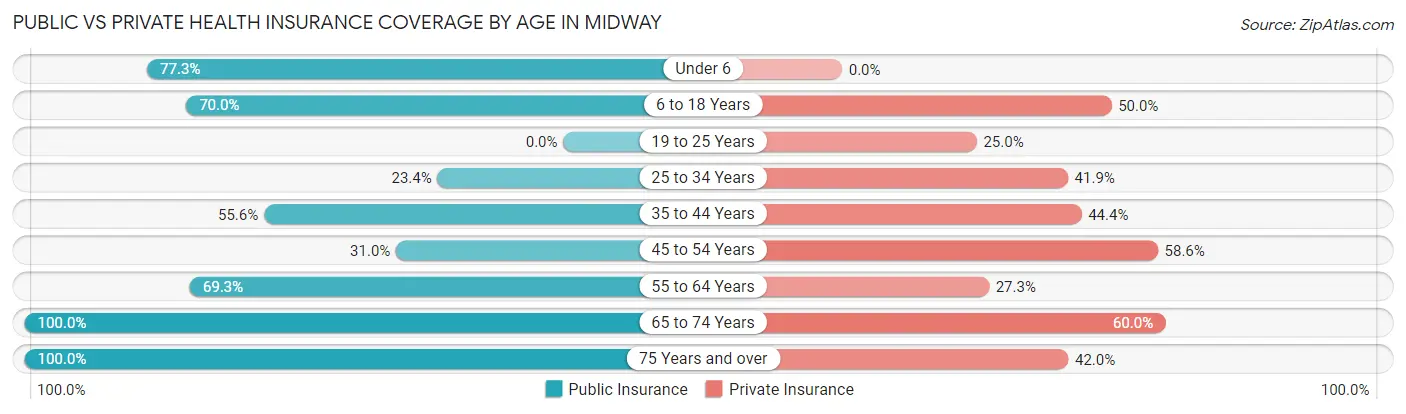
| Age Bracket | Public Insurance | Private Insurance |
| Under 6 | 34 (77.3%) | 0 (0.0%) |
| 6 to 18 Years | 7 (70.0%) | 5 (50.0%) |
| 19 to 25 Years | 0 (0.0%) | 3 (25.0%) |
| 25 to 34 Years | 39 (23.4%) | 70 (41.9%) |
| 35 to 44 Years | 5 (55.6%) | 4 (44.4%) |
| 45 to 54 Years | 27 (31.0%) | 51 (58.6%) |
| 55 to 64 Years | 61 (69.3%) | 24 (27.3%) |
| 65 to 74 Years | 40 (100.0%) | 24 (60.0%) |
| 75 Years and over | 50 (100.0%) | 21 (42.0%) |
| Total | 263 (51.9%) | 202 (39.8%) |
Disability Status by Sex by Age in Midway
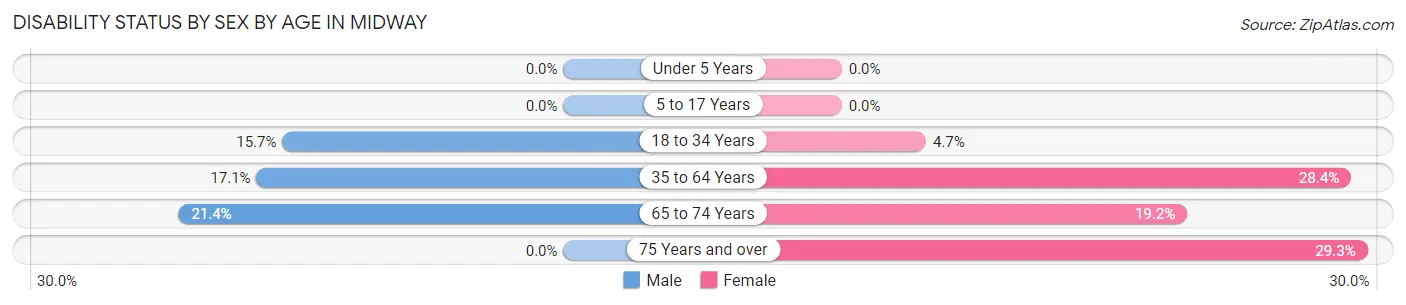
| Age Bracket | Male | Female |
| Under 5 Years | 0 (0.0%) | 0 (0.0%) |
| 5 to 17 Years | 0 (0.0%) | 0 (0.0%) |
| 18 to 34 Years | 18 (15.7%) | 3 (4.7%) |
| 35 to 64 Years | 20 (17.1%) | 19 (28.4%) |
| 65 to 74 Years | 3 (21.4%) | 5 (19.2%) |
| 75 Years and over | 0 (0.0%) | 12 (29.3%) |
Disability Class by Sex by Age in Midway
Disability Class: Hearing Difficulty
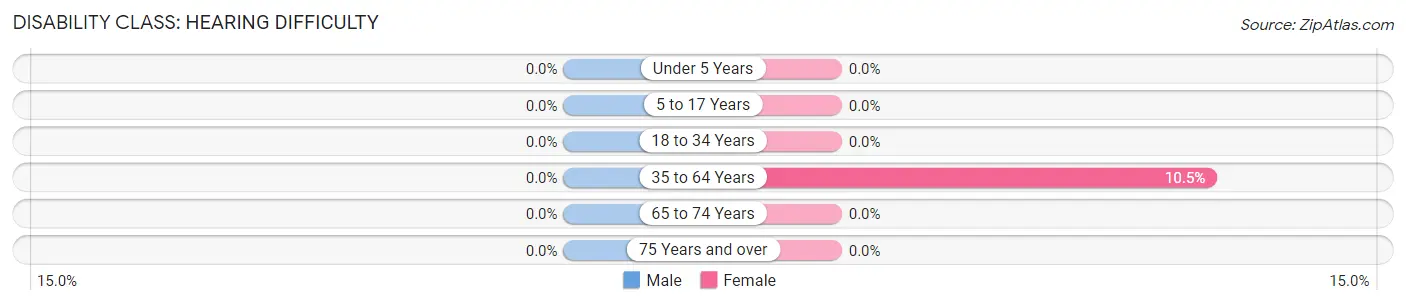
| Age Bracket | Male | Female |
| Under 5 Years | 0 (0.0%) | 0 (0.0%) |
| 5 to 17 Years | 0 (0.0%) | 0 (0.0%) |
| 18 to 34 Years | 0 (0.0%) | 0 (0.0%) |
| 35 to 64 Years | 0 (0.0%) | 7 (10.4%) |
| 65 to 74 Years | 0 (0.0%) | 0 (0.0%) |
| 75 Years and over | 0 (0.0%) | 0 (0.0%) |
Disability Class: Vision Difficulty
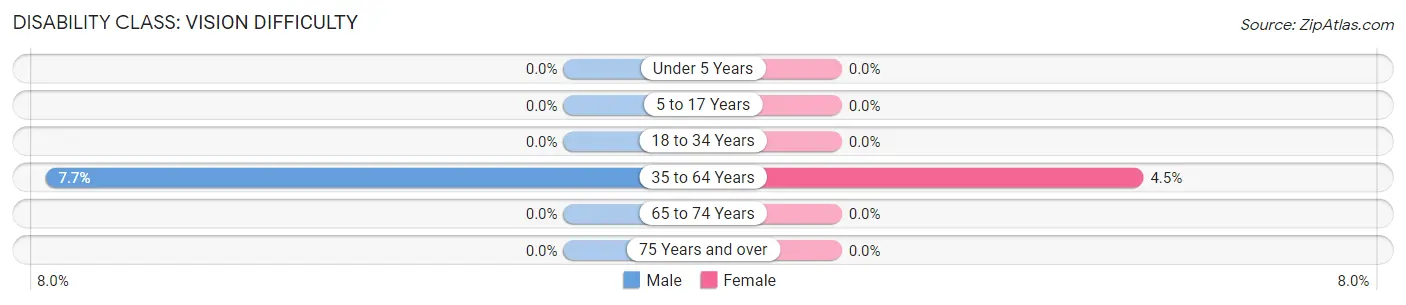
| Age Bracket | Male | Female |
| Under 5 Years | 0 (0.0%) | 0 (0.0%) |
| 5 to 17 Years | 0 (0.0%) | 0 (0.0%) |
| 18 to 34 Years | 0 (0.0%) | 0 (0.0%) |
| 35 to 64 Years | 9 (7.7%) | 3 (4.5%) |
| 65 to 74 Years | 0 (0.0%) | 0 (0.0%) |
| 75 Years and over | 0 (0.0%) | 0 (0.0%) |
Disability Class: Cognitive Difficulty
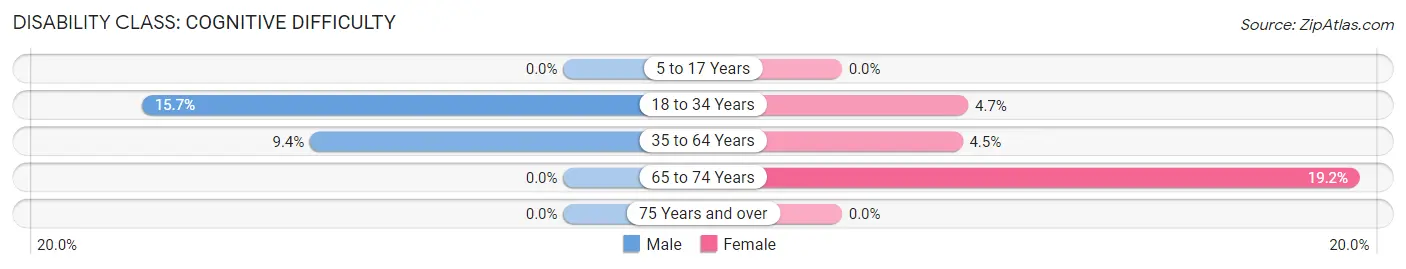
| Age Bracket | Male | Female |
| 5 to 17 Years | 0 (0.0%) | 0 (0.0%) |
| 18 to 34 Years | 18 (15.7%) | 3 (4.7%) |
| 35 to 64 Years | 11 (9.4%) | 3 (4.5%) |
| 65 to 74 Years | 0 (0.0%) | 5 (19.2%) |
| 75 Years and over | 0 (0.0%) | 0 (0.0%) |
Disability Class: Ambulatory Difficulty
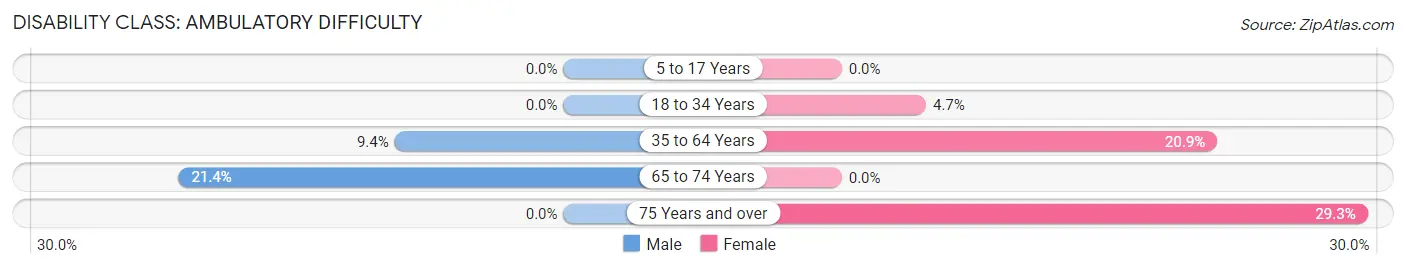
| Age Bracket | Male | Female |
| 5 to 17 Years | 0 (0.0%) | 0 (0.0%) |
| 18 to 34 Years | 0 (0.0%) | 3 (4.7%) |
| 35 to 64 Years | 11 (9.4%) | 14 (20.9%) |
| 65 to 74 Years | 3 (21.4%) | 0 (0.0%) |
| 75 Years and over | 0 (0.0%) | 12 (29.3%) |
Disability Class: Self-Care Difficulty
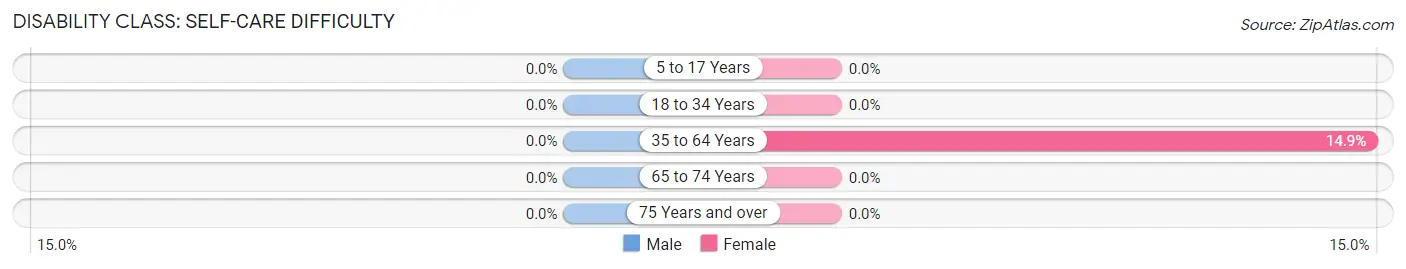
| Age Bracket | Male | Female |
| 5 to 17 Years | 0 (0.0%) | 0 (0.0%) |
| 18 to 34 Years | 0 (0.0%) | 0 (0.0%) |
| 35 to 64 Years | 0 (0.0%) | 10 (14.9%) |
| 65 to 74 Years | 0 (0.0%) | 0 (0.0%) |
| 75 Years and over | 0 (0.0%) | 0 (0.0%) |
Technology Access in Midway
Computing Device Access in Midway
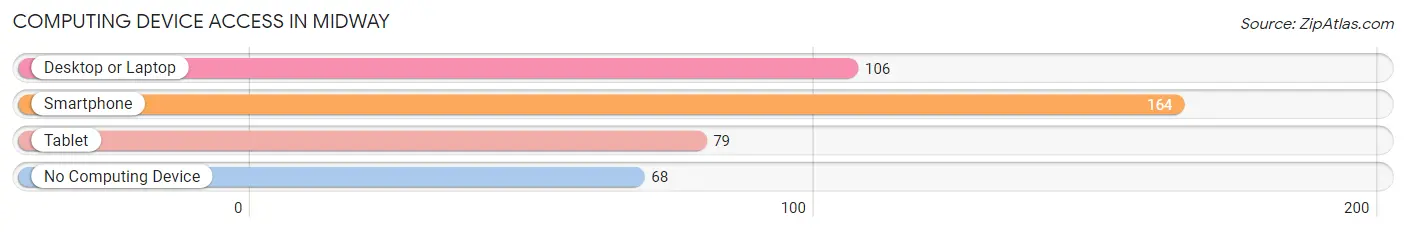
| Device Type | # Households | % Households |
| Desktop or Laptop | 106 | 45.3% |
| Smartphone | 164 | 70.1% |
| Tablet | 79 | 33.8% |
| No Computing Device | 68 | 29.1% |
| Total | 234 | 100.0% |
Internet Access in Midway
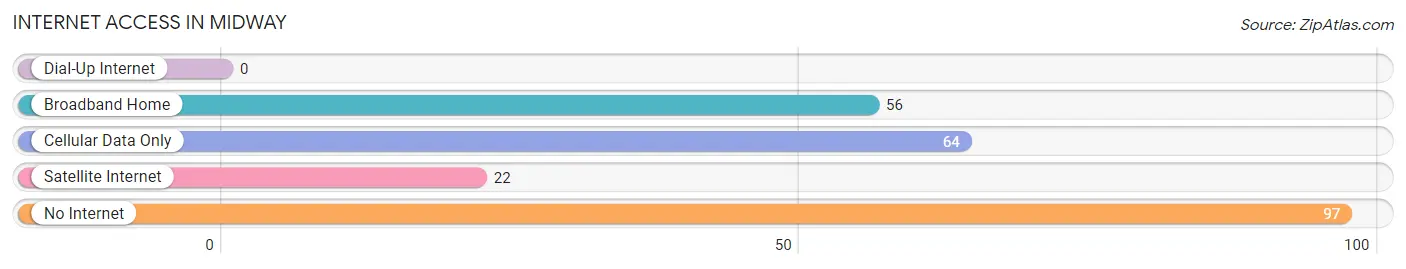
| Internet Type | # Households | % Households |
| Dial-Up Internet | 0 | 0.0% |
| Broadband Home | 56 | 23.9% |
| Cellular Data Only | 64 | 27.4% |
| Satellite Internet | 22 | 9.4% |
| No Internet | 97 | 41.4% |
| Total | 234 | 100.0% |
Midway Summary
Midway is a small town located in the state of Alabama, in the United States. It is situated in the northwest corner of the state, in the county of Limestone. The town has a population of approximately 1,000 people, and is located about 20 miles south of the state capital of Montgomery.
History
Midway was founded in 1818 by a group of settlers from Georgia. The town was originally known as “Midway Station”, and was named after the nearby Midway Church. The town was incorporated in 1821, and was the first town in Limestone County.
In the early days, Midway was a small farming community, and the main crops grown were cotton, corn, and wheat. The town also had a few small businesses, such as a general store, a blacksmith shop, and a grist mill.
In the late 1800s, the town began to grow and develop. The railroad came to Midway in 1887, and this helped to spur the growth of the town. The railroad brought new businesses and industries to the area, and the population of the town began to increase.
In the early 1900s, Midway was a thriving community. The town had several stores, a bank, a hotel, a post office, and a number of churches. The town also had a cotton gin, a sawmill, and a brickyard.
Geography
Midway is located in the northwest corner of Alabama, in Limestone County. The town is situated on the banks of the Tennessee River, and is about 20 miles south of the state capital of Montgomery.
The town is located in a rural area, and is surrounded by rolling hills and farmland. The climate in Midway is mild, with hot summers and cool winters. The average annual temperature is around 70 degrees Fahrenheit.
Economy
The economy of Midway is largely based on agriculture. The town is home to several farms, and the main crops grown are cotton, corn, and wheat. The town also has a few small businesses, such as a general store, a blacksmith shop, and a grist mill.
The town is also home to a few manufacturing companies, such as a furniture factory and a plastics factory. The town also has a few restaurants and other small businesses.
Demographics
As of the 2010 census, the population of Midway was 1,000 people. The racial makeup of the town was 95.2% White, 2.2% African American, 0.2% Native American, 0.2% Asian, 0.2% from other races, and 1.9% from two or more races.
The median household income in Midway was $31,250, and the median family income was $37,500. The per capita income in the town was $15,945. About 15.2% of the population was below the poverty line.
Conclusion
Midway is a small town located in the northwest corner of Alabama. The town has a population of approximately 1,000 people, and is located about 20 miles south of the state capital of Montgomery. The economy of Midway is largely based on agriculture, and the town also has a few small businesses. The racial makeup of the town is mostly White, with a small percentage of African American, Native American, and Asian residents. The median household income in Midway is $31,250, and the per capita income is $15,945.
Common Questions
What is the Total Population of Midway?
Total Population of Midway is 507.
What is the Total Male Population of Midway?
Total Male Population of Midway is 301.
What is the Total Female Population of Midway?
Total Female Population of Midway is 206.
What is the Ratio of Males per 100 Females in Midway?
There are 146.12 Males per 100 Females in Midway.
What is the Ratio of Females per 100 Males in Midway?
There are 68.44 Females per 100 Males in Midway.
What is the Median Population Age in Midway?
Median Population Age in Midway is 48.2 Years.
What is the Average Family Size in Midway
Average Family Size in Midway is 3.3 People.
What is the Average Household Size in Midway
Average Household Size in Midway is 2.2 People.
What is Per Capita Income in Midway?
Per Capita income in Midway is $25,832.
What is the Median Family Income in Midway?
Median Family Income in Midway is $76,000.
What is the Median Household income in Midway?
Median Household Income in Midway is $32,000.
What is Income or Wage Gap in Midway?
Income or Wage Gap in Midway is 7.0%.
Women in Midway earn 93.0 cents for every dollar earned by a man.
What is Inequality or Gini Index in Midway?
Inequality or Gini Index in Midway is 0.44.
How Large is the Labor Force in Midway?
There are 243 People in the Labor Forcein in Midway.
What is the Percentage of People in the Labor Force in Midway?
53.6% of People are in the Labor Force in Midway.
What is the Unemployment Rate in Midway?
Unemployment Rate in Midway is 16.0%.