Lillian, AL
Lillian Map
Lillian Overview
1,946
TOTAL POPULATION
983
MALE POPULATION
963
FEMALE POPULATION
102.08
MALES / 100 FEMALES
97.97
FEMALES / 100 MALES
46.8
MEDIAN AGE
3.5
AVG FAMILY SIZE
3.0
AVG HOUSEHOLD SIZE
$26,838
PER CAPITA INCOME
$64,495
AVG FAMILY INCOME
$63,462
AVG HOUSEHOLD INCOME
0.37
INEQUALITY / GINI INDEX
821
LABOR FORCE [ PEOPLE ]
48.3%
PERCENT IN LABOR FORCE
Lillian Zip Codes
Lillian Area Codes
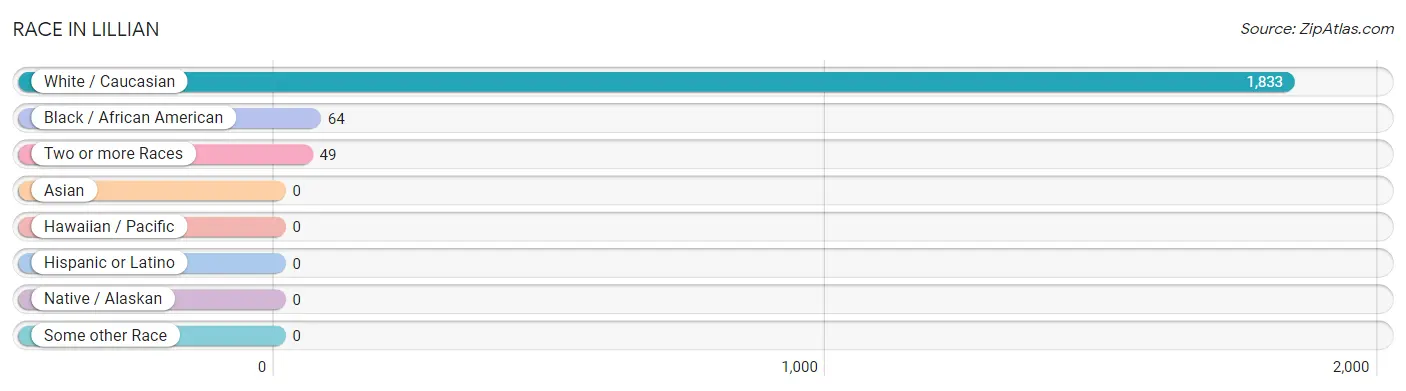
Race in Lillian
The most populous races in Lillian are White / Caucasian (1,833 | 94.2%), Black / African American (64 | 3.3%), and Two or more Races (49 | 2.5%).
| Race | # Population | % Population |
| Asian | 0 | 0.0% |
| Black / African American | 64 | 3.3% |
| Hawaiian / Pacific | 0 | 0.0% |
| Hispanic or Latino | 0 | 0.0% |
| Native / Alaskan | 0 | 0.0% |
| White / Caucasian | 1,833 | 94.2% |
| Two or more Races | 49 | 2.5% |
| Some other Race | 0 | 0.0% |
| Total | 1,946 | 100.0% |
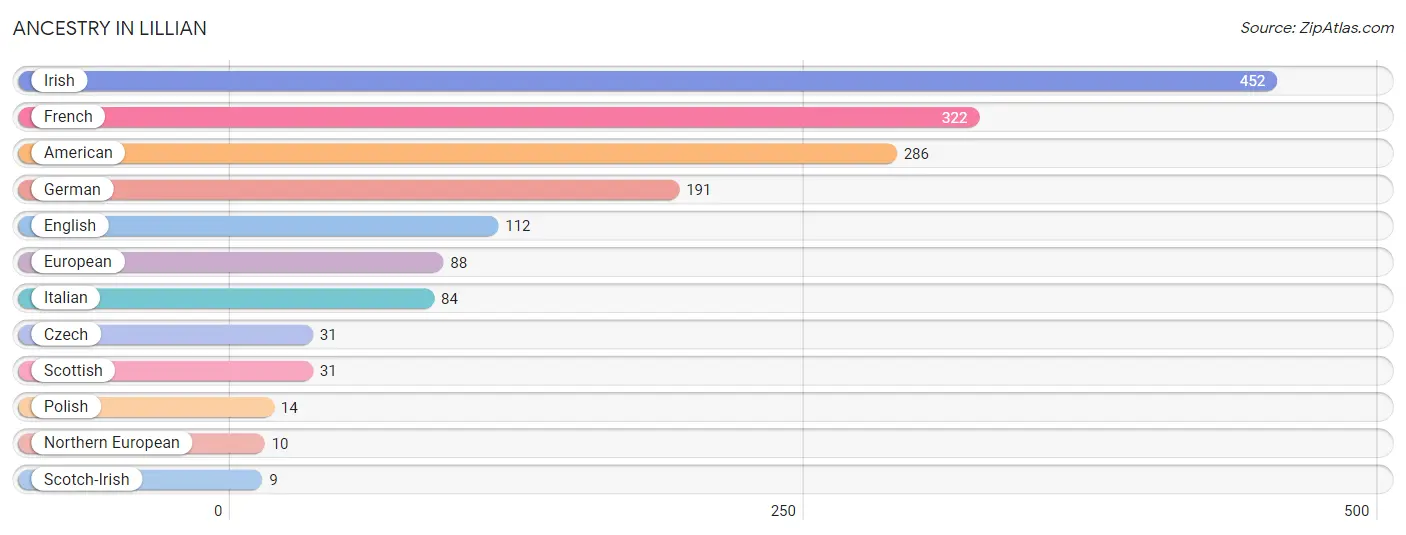
Ancestry in Lillian
The most populous ancestries reported in Lillian are Irish (452 | 23.2%), French (322 | 16.6%), American (286 | 14.7%), German (191 | 9.8%), and English (112 | 5.8%), together accounting for 70.1% of all Lillian residents.
| Ancestry | # Population | % Population |
| American | 286 | 14.7% |
| Czech | 31 | 1.6% |
| English | 112 | 5.8% |
| European | 88 | 4.5% |
| French | 322 | 16.6% |
| German | 191 | 9.8% |
| Irish | 452 | 23.2% |
| Italian | 84 | 4.3% |
| Northern European | 10 | 0.5% |
| Polish | 14 | 0.7% |
| Scotch-Irish | 9 | 0.5% |
| Scottish | 31 | 1.6% | View All 12 Rows |
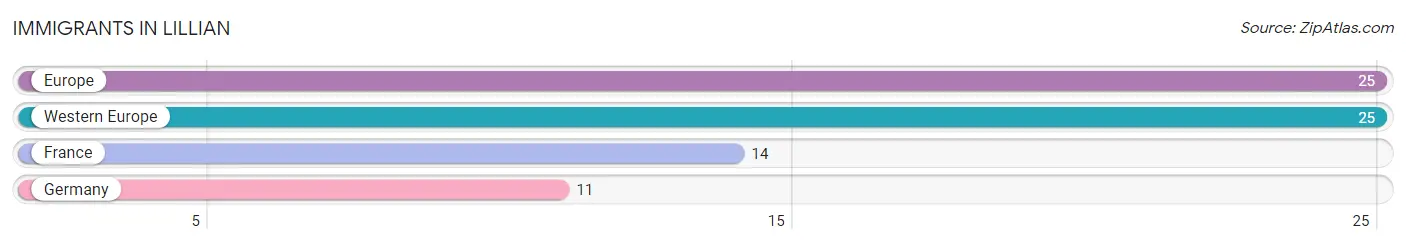
Immigrants in Lillian
The most numerous immigrant groups reported in Lillian came from Europe (25 | 1.3%), Western Europe (25 | 1.3%), France (14 | 0.7%), and Germany (11 | 0.6%), together accounting for 3.9% of all Lillian residents.
| Immigration Origin | # Population | % Population |
| Europe | 25 | 1.3% |
| France | 14 | 0.7% |
| Germany | 11 | 0.6% |
| Western Europe | 25 | 1.3% | View All 4 Rows |
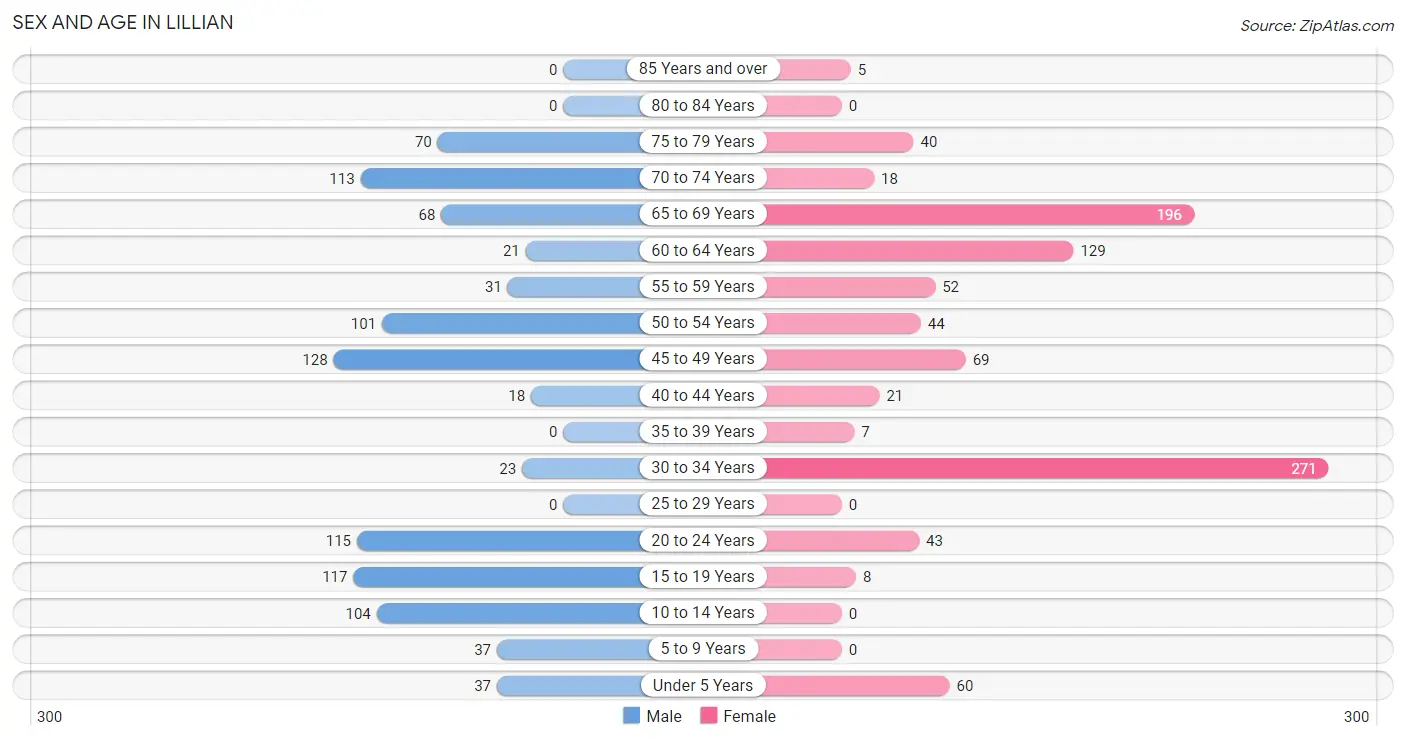
Sex and Age in Lillian
Sex and Age in Lillian
The most populous age groups in Lillian are 45 to 49 Years (128 | 13.0%) for men and 30 to 34 Years (271 | 28.1%) for women.
| Age Bracket | Male | Female |
| Under 5 Years | 37 (3.8%) | 60 (6.2%) |
| 5 to 9 Years | 37 (3.8%) | 0 (0.0%) |
| 10 to 14 Years | 104 (10.6%) | 0 (0.0%) |
| 15 to 19 Years | 117 (11.9%) | 8 (0.8%) |
| 20 to 24 Years | 115 (11.7%) | 43 (4.5%) |
| 25 to 29 Years | 0 (0.0%) | 0 (0.0%) |
| 30 to 34 Years | 23 (2.3%) | 271 (28.1%) |
| 35 to 39 Years | 0 (0.0%) | 7 (0.7%) |
| 40 to 44 Years | 18 (1.8%) | 21 (2.2%) |
| 45 to 49 Years | 128 (13.0%) | 69 (7.2%) |
| 50 to 54 Years | 101 (10.3%) | 44 (4.6%) |
| 55 to 59 Years | 31 (3.2%) | 52 (5.4%) |
| 60 to 64 Years | 21 (2.1%) | 129 (13.4%) |
| 65 to 69 Years | 68 (6.9%) | 196 (20.3%) |
| 70 to 74 Years | 113 (11.5%) | 18 (1.9%) |
| 75 to 79 Years | 70 (7.1%) | 40 (4.2%) |
| 80 to 84 Years | 0 (0.0%) | 0 (0.0%) |
| 85 Years and over | 0 (0.0%) | 5 (0.5%) |
| Total | 983 (100.0%) | 963 (100.0%) |
Families and Households in Lillian
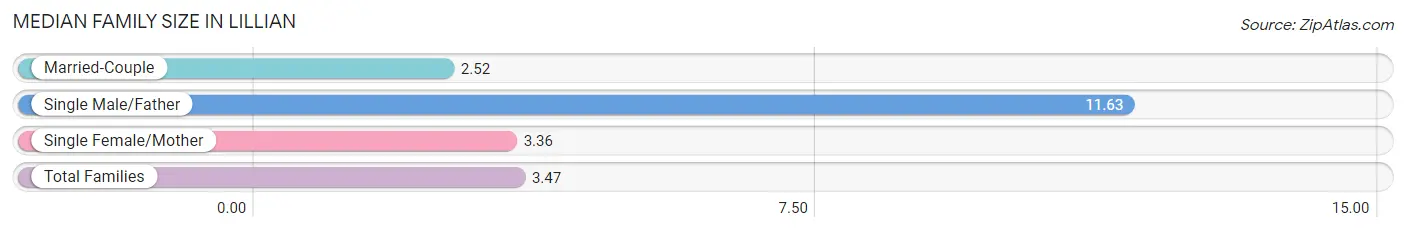
Median Family Size in Lillian
The median family size in Lillian is 3.47 persons per family, with single male/father families (40 | 8.0%) accounting for the largest median family size of 11.63 persons per family. On the other hand, married-couple families (328 | 65.7%) represent the smallest median family size with 2.52 persons per family.
| Family Type | # Families | Family Size |
| Married-Couple | 328 (65.7%) | 2.52 |
| Single Male/Father | 40 (8.0%) | 11.63 |
| Single Female/Mother | 131 (26.3%) | 3.36 |
| Total Families | 499 (100.0%) | 3.47 |
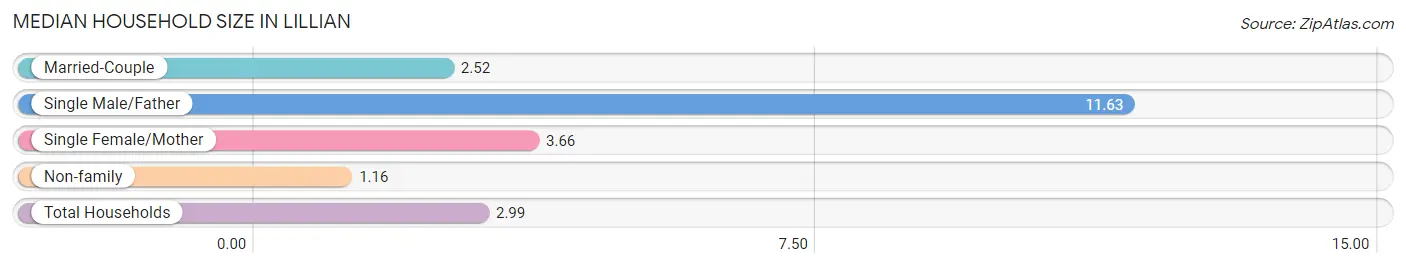
Median Household Size in Lillian
The median household size in Lillian is 2.99 persons per household, with single male/father households (40 | 6.1%) accounting for the largest median household size of 11.63 persons per household. non-family households (151 | 23.2%) represent the smallest median household size with 1.16 persons per household.
| Household Type | # Households | Household Size |
| Married-Couple | 328 (50.5%) | 2.52 |
| Single Male/Father | 40 (6.1%) | 11.63 |
| Single Female/Mother | 131 (20.2%) | 3.66 |
| Non-family | 151 (23.2%) | 1.16 |
| Total Households | 650 (100.0%) | 2.99 |
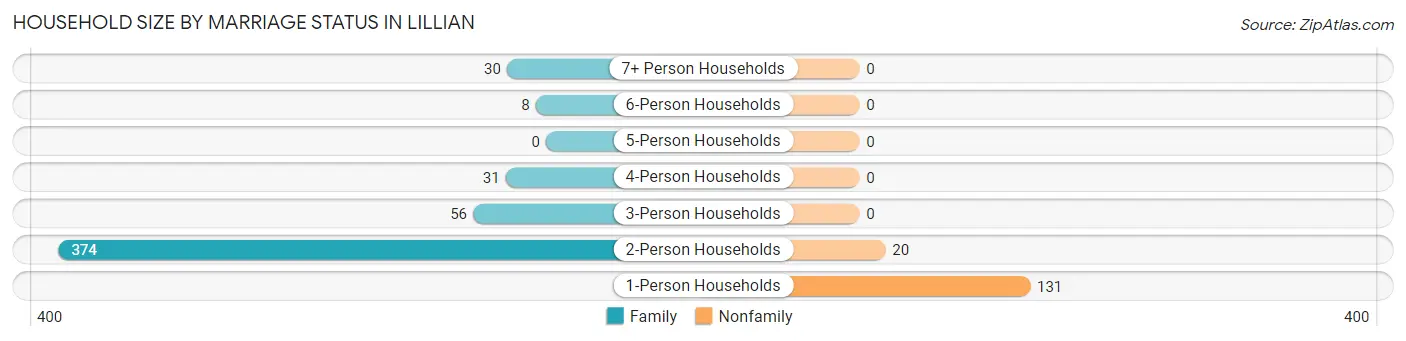
Household Size by Marriage Status in Lillian
Out of a total of 650 households in Lillian, 499 (76.8%) are family households, while 151 (23.2%) are nonfamily households. The most numerous type of family households are 2-person households, comprising 374, and the most common type of nonfamily households are 1-person households, comprising 131.
| Household Size | Family Households | Nonfamily Households |
| 1-Person Households | - | 131 (20.2%) |
| 2-Person Households | 374 (57.5%) | 20 (3.1%) |
| 3-Person Households | 56 (8.6%) | 0 (0.0%) |
| 4-Person Households | 31 (4.8%) | 0 (0.0%) |
| 5-Person Households | 0 (0.0%) | 0 (0.0%) |
| 6-Person Households | 8 (1.2%) | 0 (0.0%) |
| 7+ Person Households | 30 (4.6%) | 0 (0.0%) |
| Total | 499 (76.8%) | 151 (23.2%) |
Female Fertility in Lillian
Fertility by Age in Lillian
| Age Bracket | Women with Births | Births / 1,000 Women |
| 15 to 19 years | 0 (0.0%) | 0.0 |
| 20 to 34 years | 0 (0.0%) | 0.0 |
| 35 to 50 years | 0 (0.0%) | 0.0 |
| Total | 0 (0.0%) | 0.0 |
Fertility by Age by Marriage Status in Lillian
| Age Bracket | Married | Unmarried |
| 15 to 19 years | 0 (0.0%) | 0 (0.0%) |
| 20 to 34 years | 0 (0.0%) | 0 (0.0%) |
| 35 to 50 years | 0 (0.0%) | 0 (0.0%) |
| Total | 0 (0.0%) | 0 (0.0%) |
Fertility by Education in Lillian
| Educational Attainment | Women with Births | Births / 1,000 Women |
| Less than High School | 0 (0.0%) | 0.0 |
| High School Diploma | 0 (0.0%) | 0.0 |
| College or Associate's Degree | 0 (0.0%) | 0.0 |
| Bachelor's Degree | 0 (0.0%) | 0.0 |
| Graduate Degree | 0 (0.0%) | 0.0 |
| Total | 0 (0.0%) | 0.0 |
Fertility by Education by Marriage Status in Lillian
| Educational Attainment | Married | Unmarried |
| Less than High School | 0 (0.0%) | 0 (0.0%) |
| High School Diploma | 0 (0.0%) | 0 (0.0%) |
| College or Associate's Degree | 0 (0.0%) | 0 (0.0%) |
| Bachelor's Degree | 0 (0.0%) | 0 (0.0%) |
| Graduate Degree | 0 (0.0%) | 0 (0.0%) |
| Total | 0 (0.0%) | 0 (0.0%) |
Income in Lillian
Income Overview in Lillian
Per Capita Income in Lillian is $26,838, while median incomes of families and households are $64,495 and $63,462 respectively.
| Characteristic | Number | Measure |
| Per Capita Income | 1,946 | $26,838 |
| Median Family Income | 499 | $64,495 |
| Mean Family Income | 499 | $77,076 |
| Median Household Income | 650 | $63,462 |
| Mean Household Income | 650 | $75,040 |
| Income Deficit | 499 | $0 |
| Wage / Income Gap (%) | 1,946 | 0.00% |
| Wage / Income Gap ($) | 1,946 | 100.00¢ per $1 |
| Gini / Inequality Index | 1,946 | 0.37 |
Earnings by Sex in Lillian
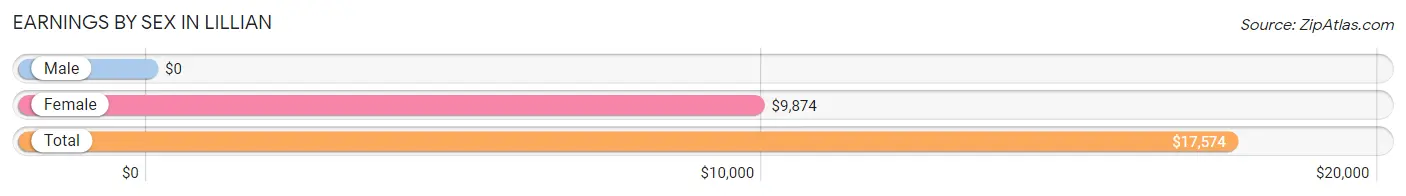
| Sex | Number | Average Earnings |
| Male | 337 (41.0%) | $0 |
| Female | 484 (59.0%) | $9,874 |
| Total | 821 (100.0%) | $17,574 |
Earnings by Sex by Income Bracket in Lillian
The most common earnings brackets in Lillian are $17,500 to $19,999 for men (85 | 25.2%) and $7,500 to $9,999 for women (219 | 45.3%).
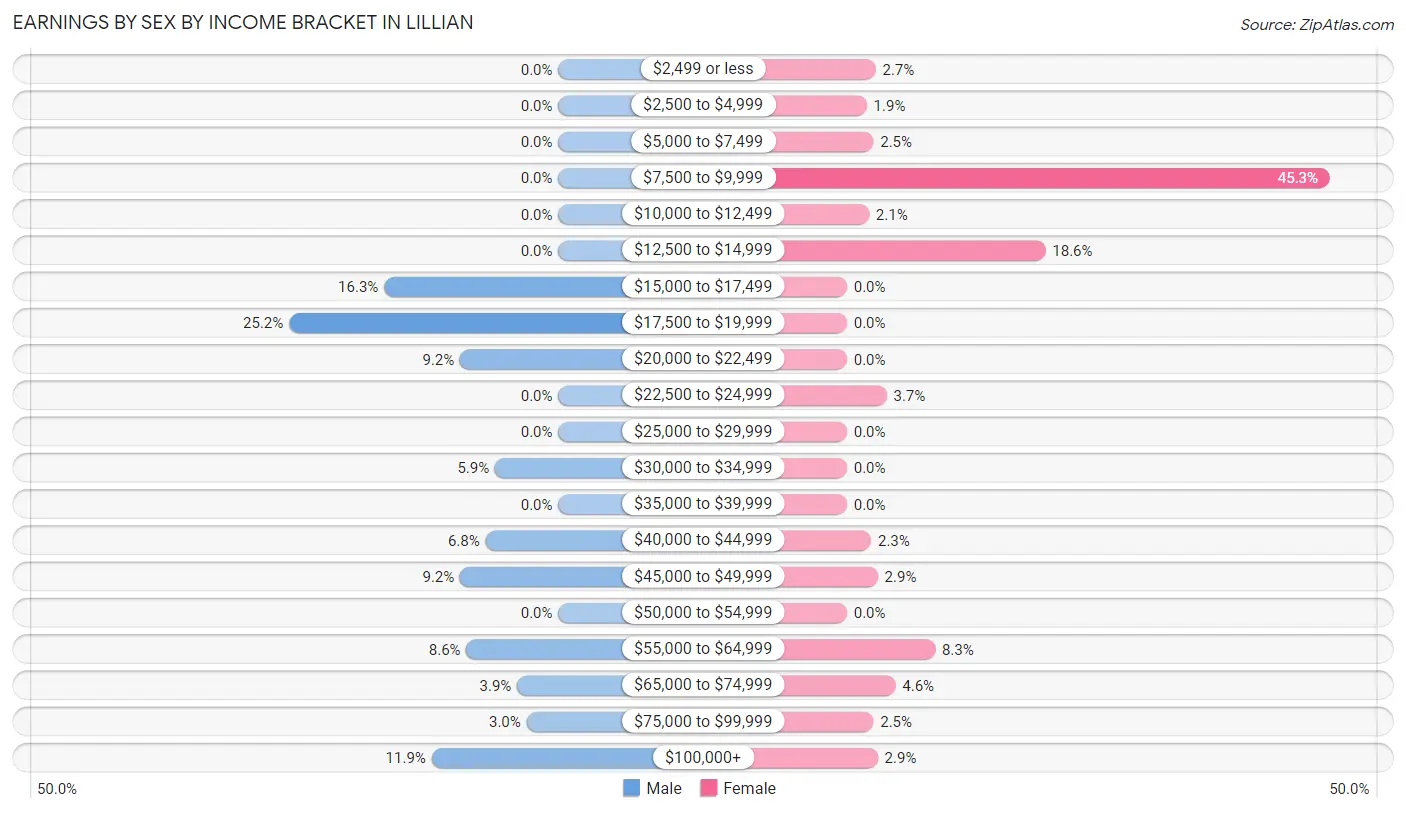
| Income | Male | Female |
| $2,499 or less | 0 (0.0%) | 13 (2.7%) |
| $2,500 to $4,999 | 0 (0.0%) | 9 (1.9%) |
| $5,000 to $7,499 | 0 (0.0%) | 12 (2.5%) |
| $7,500 to $9,999 | 0 (0.0%) | 219 (45.3%) |
| $10,000 to $12,499 | 0 (0.0%) | 10 (2.1%) |
| $12,500 to $14,999 | 0 (0.0%) | 90 (18.6%) |
| $15,000 to $17,499 | 55 (16.3%) | 0 (0.0%) |
| $17,500 to $19,999 | 85 (25.2%) | 0 (0.0%) |
| $20,000 to $22,499 | 31 (9.2%) | 0 (0.0%) |
| $22,500 to $24,999 | 0 (0.0%) | 18 (3.7%) |
| $25,000 to $29,999 | 0 (0.0%) | 0 (0.0%) |
| $30,000 to $34,999 | 20 (5.9%) | 0 (0.0%) |
| $35,000 to $39,999 | 0 (0.0%) | 0 (0.0%) |
| $40,000 to $44,999 | 23 (6.8%) | 11 (2.3%) |
| $45,000 to $49,999 | 31 (9.2%) | 14 (2.9%) |
| $50,000 to $54,999 | 0 (0.0%) | 0 (0.0%) |
| $55,000 to $64,999 | 29 (8.6%) | 40 (8.3%) |
| $65,000 to $74,999 | 13 (3.9%) | 22 (4.5%) |
| $75,000 to $99,999 | 10 (3.0%) | 12 (2.5%) |
| $100,000+ | 40 (11.9%) | 14 (2.9%) |
| Total | 337 (100.0%) | 484 (100.0%) |
Earnings by Sex by Educational Attainment in Lillian
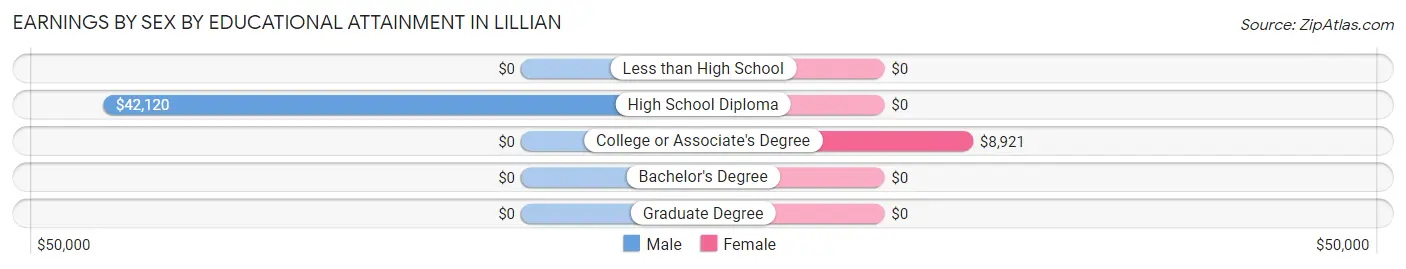
| Educational Attainment | Male Income | Female Income |
| Less than High School | - | - |
| High School Diploma | $42,120 | $0 |
| College or Associate's Degree | - | - |
| Bachelor's Degree | - | - |
| Graduate Degree | - | - |
| Total | $40,217 | $0 |
Family Income in Lillian
Family Income Brackets in Lillian
According to the Lillian family income data, there are 148 families falling into the $25,000 to $34,999 income range, which is the most common income bracket and makes up 29.7% of all families.
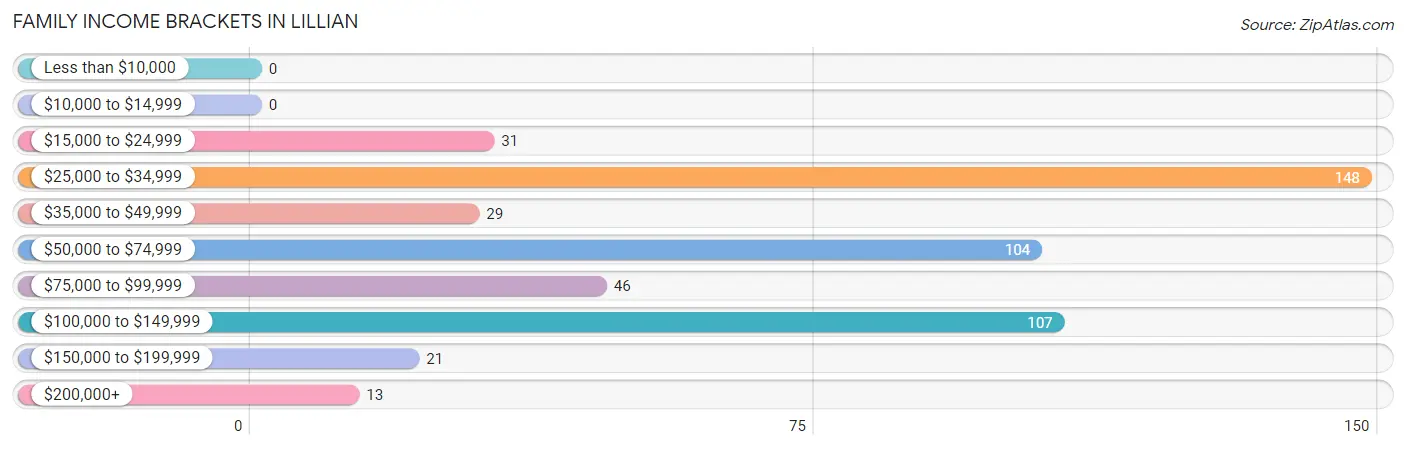
| Income Bracket | # Families | % Families |
| Less than $10,000 | 0 | 0.0% |
| $10,000 to $14,999 | 0 | 0.0% |
| $15,000 to $24,999 | 31 | 6.2% |
| $25,000 to $34,999 | 148 | 29.7% |
| $35,000 to $49,999 | 29 | 5.8% |
| $50,000 to $74,999 | 104 | 20.8% |
| $75,000 to $99,999 | 46 | 9.2% |
| $100,000 to $149,999 | 107 | 21.4% |
| $150,000 to $199,999 | 21 | 4.2% |
| $200,000+ | 13 | 2.6% |
Family Income by Famaliy Size in Lillian
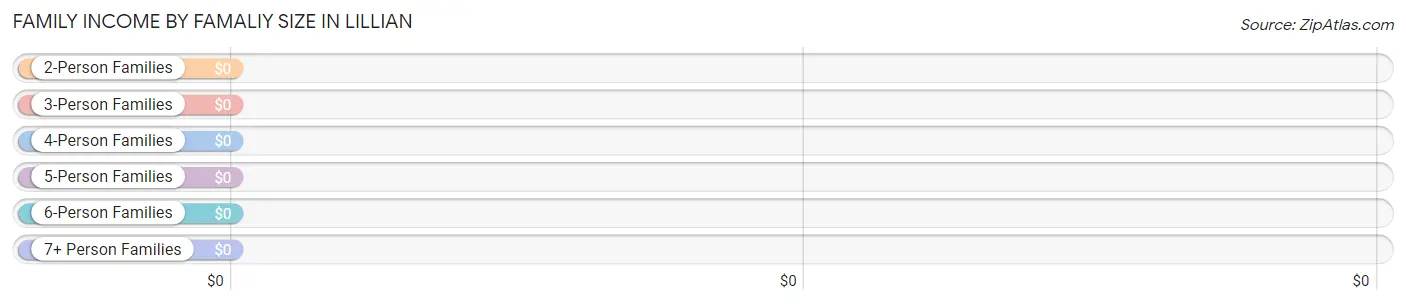
| Income Bracket | # Families | Median Income |
| 2-Person Families | 397 (79.6%) | $0 |
| 3-Person Families | 33 (6.6%) | $0 |
| 4-Person Families | 31 (6.2%) | $0 |
| 5-Person Families | 0 (0.0%) | $0 |
| 6-Person Families | 8 (1.6%) | $0 |
| 7+ Person Families | 30 (6.0%) | $0 |
| Total | 499 (100.0%) | $64,495 |
Family Income by Number of Earners in Lillian
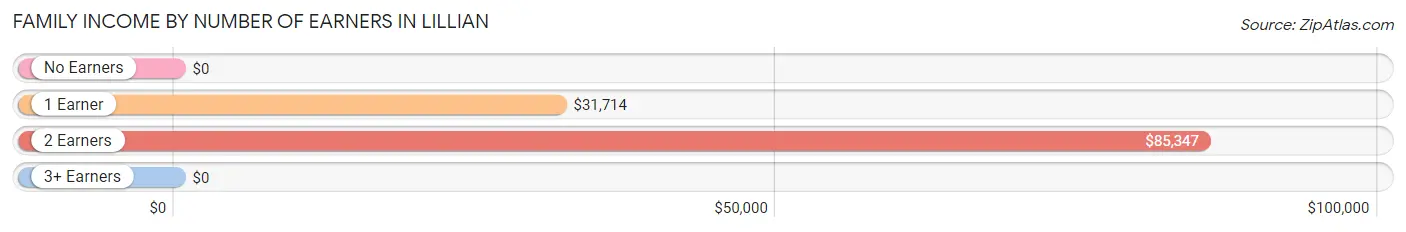
| Number of Earners | # Families | Median Income |
| No Earners | 175 (35.1%) | $0 |
| 1 Earner | 205 (41.1%) | $31,714 |
| 2 Earners | 89 (17.8%) | $85,347 |
| 3+ Earners | 30 (6.0%) | $0 |
| Total | 499 (100.0%) | $64,495 |
Household Income in Lillian
Household Income Brackets in Lillian
With 174 households falling in the category, the $25,000 to $34,999 income range is the most frequent in Lillian, accounting for 26.8% of all households.
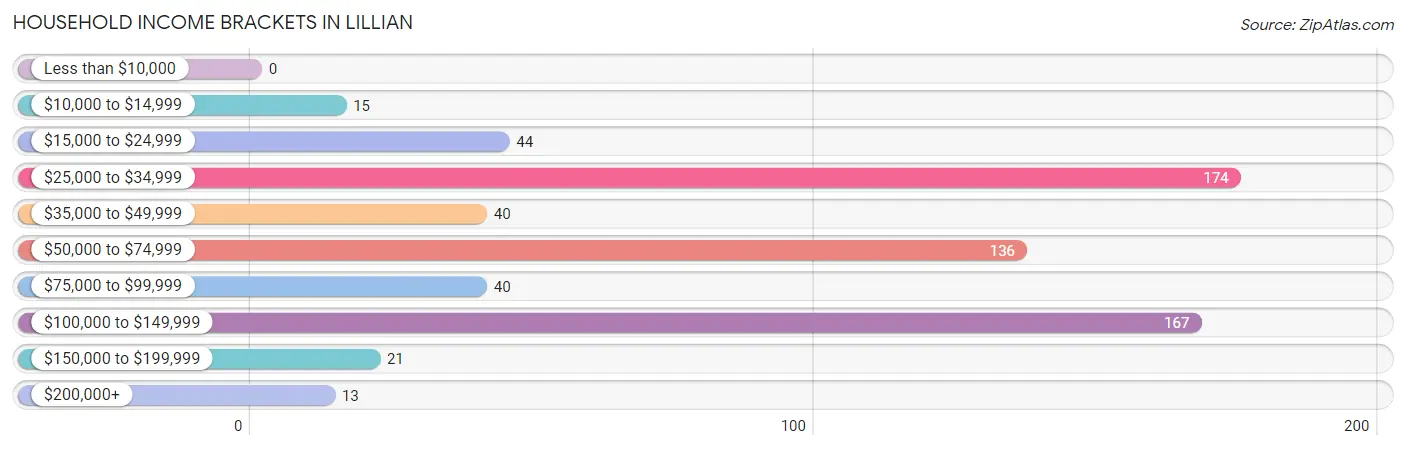
| Income Bracket | # Households | % Households |
| Less than $10,000 | 0 | 0.0% |
| $10,000 to $14,999 | 15 | 2.3% |
| $15,000 to $24,999 | 44 | 6.8% |
| $25,000 to $34,999 | 174 | 26.8% |
| $35,000 to $49,999 | 40 | 6.2% |
| $50,000 to $74,999 | 136 | 20.9% |
| $75,000 to $99,999 | 40 | 6.2% |
| $100,000 to $149,999 | 167 | 25.7% |
| $150,000 to $199,999 | 21 | 3.2% |
| $200,000+ | 13 | 2.0% |
Household Income by Householder Age in Lillian
The median household income in Lillian is $63,462, with the highest median household income of $79,125 found in the 25 to 44 years age bracket for the primary householder. A total of 91 households (14.0%) fall into this category. Meanwhile, the 15 to 24 years age bracket for the primary householder has the lowest median household income of $0, with 33 households (5.1%) in this group.
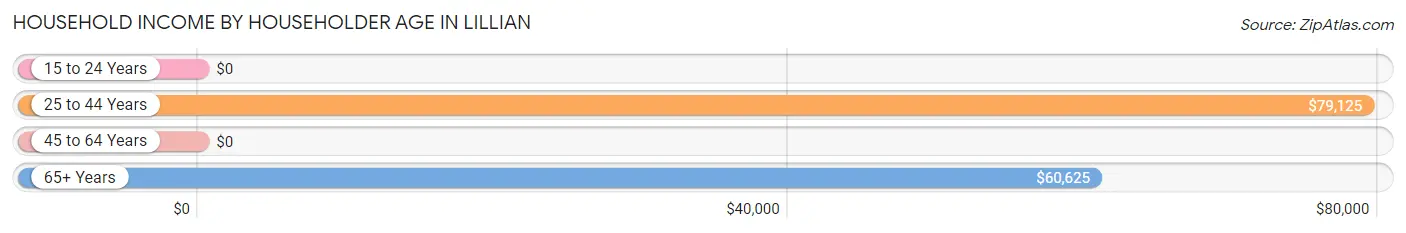
| Income Bracket | # Households | Median Income |
| 15 to 24 Years | 33 (5.1%) | $0 |
| 25 to 44 Years | 91 (14.0%) | $79,125 |
| 45 to 64 Years | 133 (20.5%) | $0 |
| 65+ Years | 393 (60.5%) | $60,625 |
| Total | 650 (100.0%) | $63,462 |
Poverty in Lillian
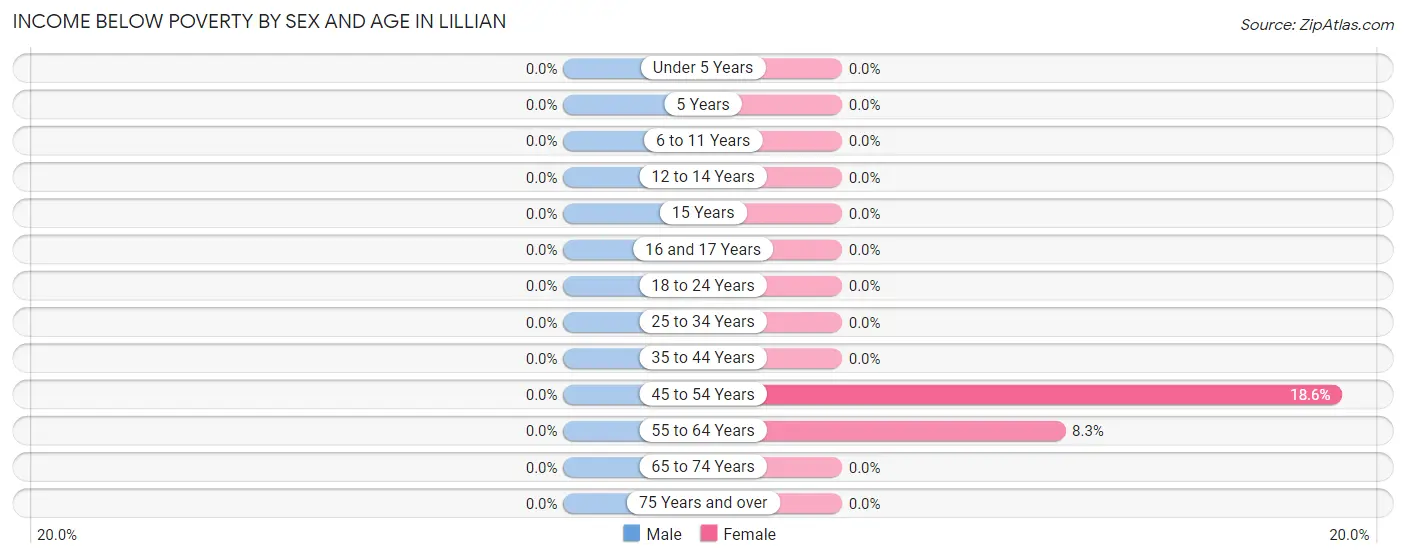
Income Below Poverty by Sex and Age in Lillian
| Age Bracket | Male | Female |
| Under 5 Years | 0 (0.0%) | 0 (0.0%) |
| 5 Years | 0 (0.0%) | 0 (0.0%) |
| 6 to 11 Years | 0 (0.0%) | 0 (0.0%) |
| 12 to 14 Years | 0 (0.0%) | 0 (0.0%) |
| 15 Years | 0 (0.0%) | 0 (0.0%) |
| 16 and 17 Years | 0 (0.0%) | 0 (0.0%) |
| 18 to 24 Years | 0 (0.0%) | 0 (0.0%) |
| 25 to 34 Years | 0 (0.0%) | 0 (0.0%) |
| 35 to 44 Years | 0 (0.0%) | 0 (0.0%) |
| 45 to 54 Years | 0 (0.0%) | 21 (18.6%) |
| 55 to 64 Years | 0 (0.0%) | 15 (8.3%) |
| 65 to 74 Years | 0 (0.0%) | 0 (0.0%) |
| 75 Years and over | 0 (0.0%) | 0 (0.0%) |
| Total | 0 (0.0%) | 36 (3.7%) |
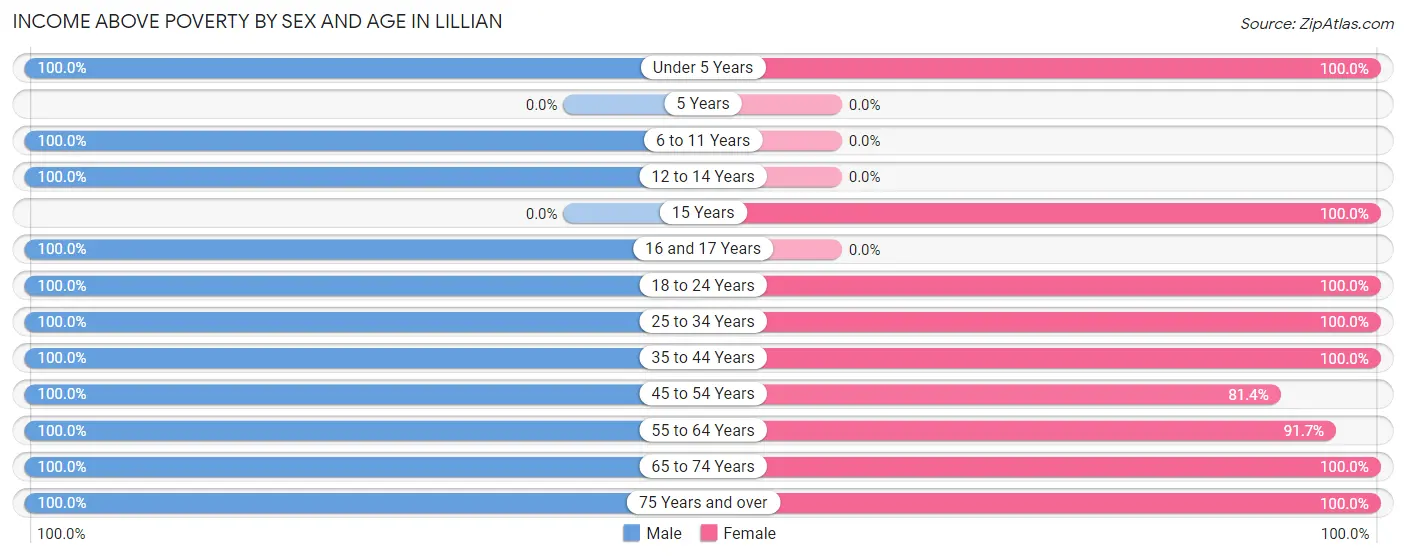
Income Above Poverty by Sex and Age in Lillian
According to the poverty statistics in Lillian, males aged under 5 years and females aged under 5 years are the age groups that are most secure financially, with 100.0% of males and 100.0% of females in these age groups living above the poverty line.
| Age Bracket | Male | Female |
| Under 5 Years | 37 (100.0%) | 60 (100.0%) |
| 5 Years | 0 (0.0%) | 0 (0.0%) |
| 6 to 11 Years | 74 (100.0%) | 0 (0.0%) |
| 12 to 14 Years | 67 (100.0%) | 0 (0.0%) |
| 15 Years | 0 (0.0%) | 8 (100.0%) |
| 16 and 17 Years | 77 (100.0%) | 0 (0.0%) |
| 18 to 24 Years | 155 (100.0%) | 43 (100.0%) |
| 25 to 34 Years | 23 (100.0%) | 271 (100.0%) |
| 35 to 44 Years | 18 (100.0%) | 28 (100.0%) |
| 45 to 54 Years | 229 (100.0%) | 92 (81.4%) |
| 55 to 64 Years | 52 (100.0%) | 166 (91.7%) |
| 65 to 74 Years | 181 (100.0%) | 214 (100.0%) |
| 75 Years and over | 70 (100.0%) | 45 (100.0%) |
| Total | 983 (100.0%) | 927 (96.3%) |
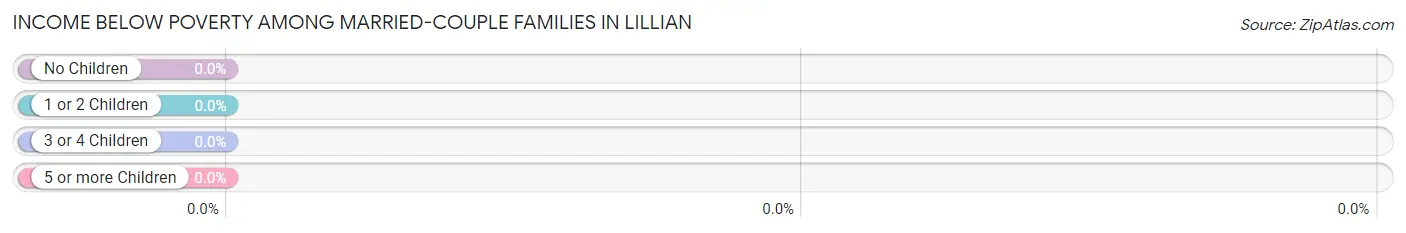
Income Below Poverty Among Married-Couple Families in Lillian
| Children | Above Poverty | Below Poverty |
| No Children | 298 (100.0%) | 0 (0.0%) |
| 1 or 2 Children | 22 (100.0%) | 0 (0.0%) |
| 3 or 4 Children | 8 (100.0%) | 0 (0.0%) |
| 5 or more Children | 0 (0.0%) | 0 (0.0%) |
| Total | 328 (100.0%) | 0 (0.0%) |
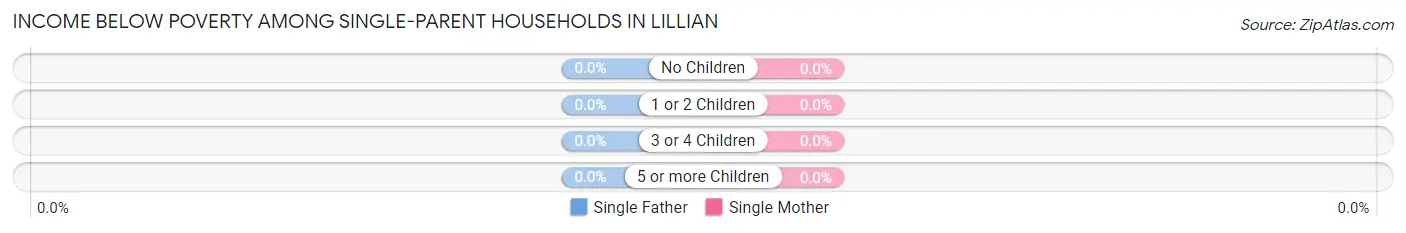
Income Below Poverty Among Single-Parent Households in Lillian
| Children | Single Father | Single Mother |
| No Children | 0 (0.0%) | 0 (0.0%) |
| 1 or 2 Children | 0 (0.0%) | 0 (0.0%) |
| 3 or 4 Children | 0 (0.0%) | 0 (0.0%) |
| 5 or more Children | 0 (0.0%) | 0 (0.0%) |
| Total | 0 (0.0%) | 0 (0.0%) |
Income Below Poverty Among Married-Couple vs Single-Parent Households in Lillian
| Children | Married-Couple Families | Single-Parent Households |
| No Children | 0 (0.0%) | 0 (0.0%) |
| 1 or 2 Children | 0 (0.0%) | 0 (0.0%) |
| 3 or 4 Children | 0 (0.0%) | 0 (0.0%) |
| 5 or more Children | 0 (0.0%) | 0 (0.0%) |
| Total | 0 (0.0%) | 0 (0.0%) |
Employment Characteristics in Lillian
Employment by Class of Employer in Lillian
Among the 799 employed individuals in Lillian, private company employees (708 | 88.6%), not-for-profit organizations (45 | 5.6%), and local government employees (28 | 3.5%) make up the most common classes of employment.
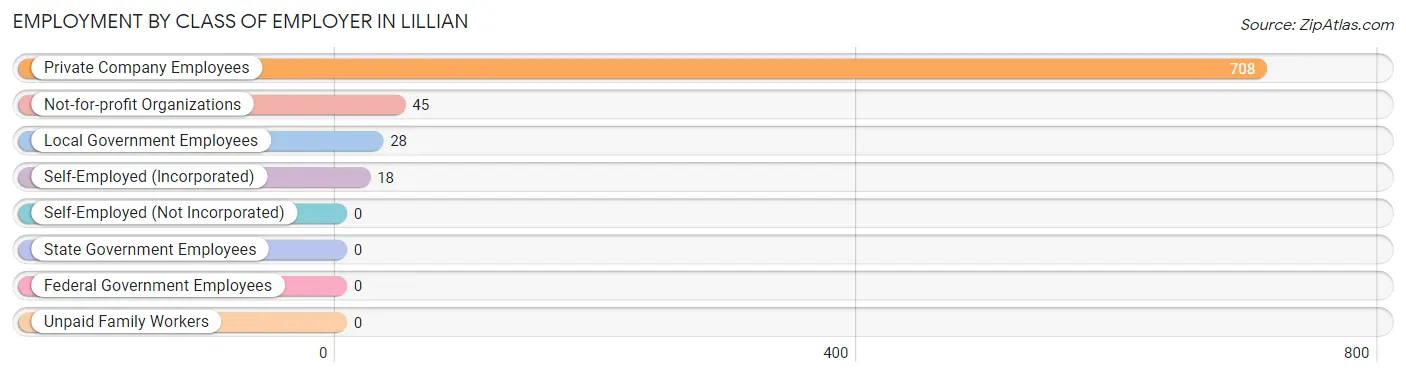
| Employer Class | # Employees | % Employees |
| Private Company Employees | 708 | 88.6% |
| Self-Employed (Incorporated) | 18 | 2.2% |
| Self-Employed (Not Incorporated) | 0 | 0.0% |
| Not-for-profit Organizations | 45 | 5.6% |
| Local Government Employees | 28 | 3.5% |
| State Government Employees | 0 | 0.0% |
| Federal Government Employees | 0 | 0.0% |
| Unpaid Family Workers | 0 | 0.0% |
| Total | 799 | 100.0% |
Employment Status by Age in Lillian
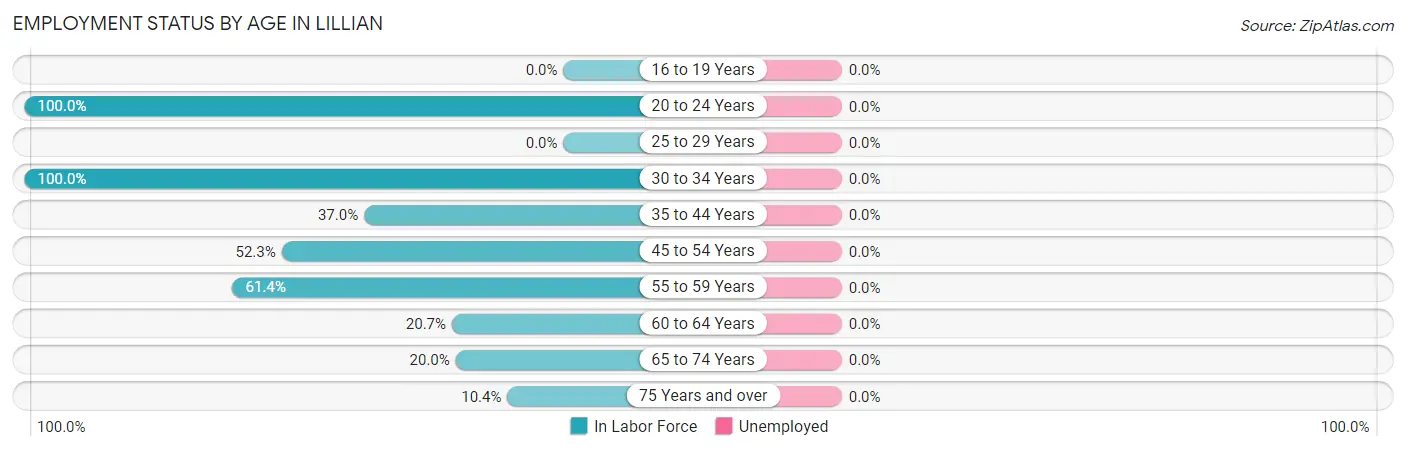
| Age Bracket | In Labor Force | Unemployed |
| 16 to 19 Years | 0 (0.0%) | 0 (0.0%) |
| 20 to 24 Years | 158 (100.0%) | 0 (0.0%) |
| 25 to 29 Years | 0 (0.0%) | 0 (0.0%) |
| 30 to 34 Years | 294 (100.0%) | 0 (0.0%) |
| 35 to 44 Years | 17 (37.0%) | 0 (0.0%) |
| 45 to 54 Years | 179 (52.3%) | 0 (0.0%) |
| 55 to 59 Years | 51 (61.4%) | 0 (0.0%) |
| 60 to 64 Years | 31 (20.7%) | 0 (0.0%) |
| 65 to 74 Years | 79 (20.0%) | 0 (0.0%) |
| 75 Years and over | 12 (10.4%) | 0 (0.0%) |
| Total | 821 (48.3%) | 0 (0.0%) |
Employment Status by Educational Attainment in Lillian
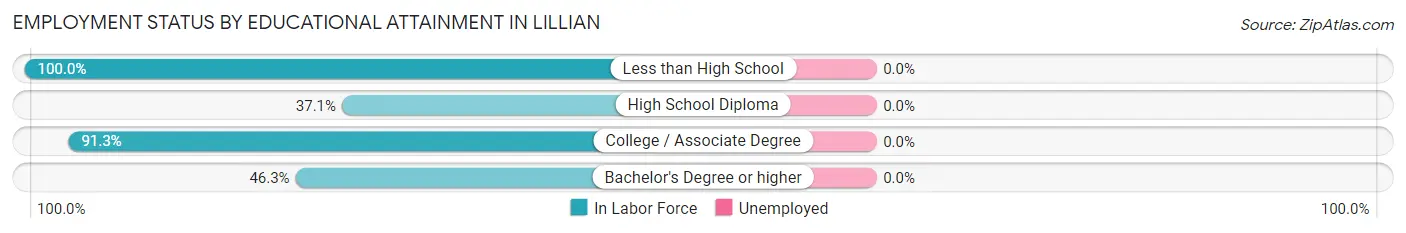
| Educational Attainment | In Labor Force | Unemployed |
| Less than High School | 51 (100.0%) | 0 (0.0%) |
| High School Diploma | 117 (37.1%) | 0 (0.0%) |
| College / Associate Degree | 304 (91.3%) | 0 (0.0%) |
| Bachelor's Degree or higher | 100 (46.3%) | 0 (0.0%) |
| Total | 572 (62.5%) | 0 (0.0%) |
Employment Occupations by Sex in Lillian
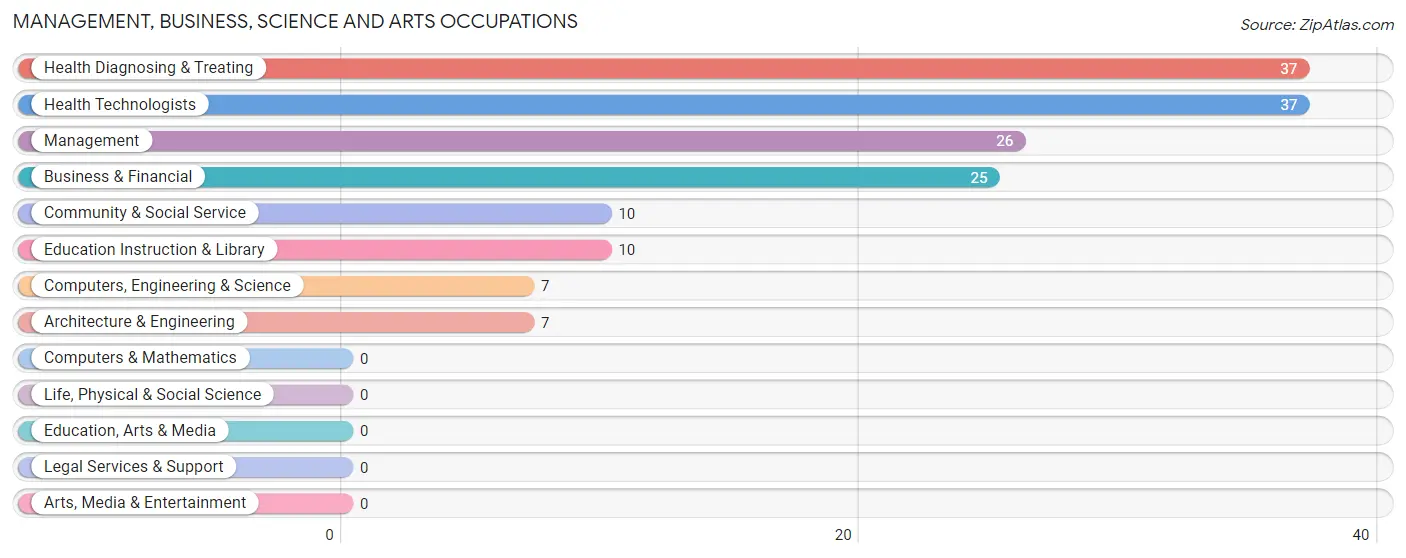
Management, Business, Science and Arts Occupations
The most common Management, Business, Science and Arts occupations in Lillian are Health Diagnosing & Treating (37 | 4.5%), Health Technologists (37 | 4.5%), Management (26 | 3.2%), Business & Financial (25 | 3.0%), and Community & Social Service (10 | 1.2%).
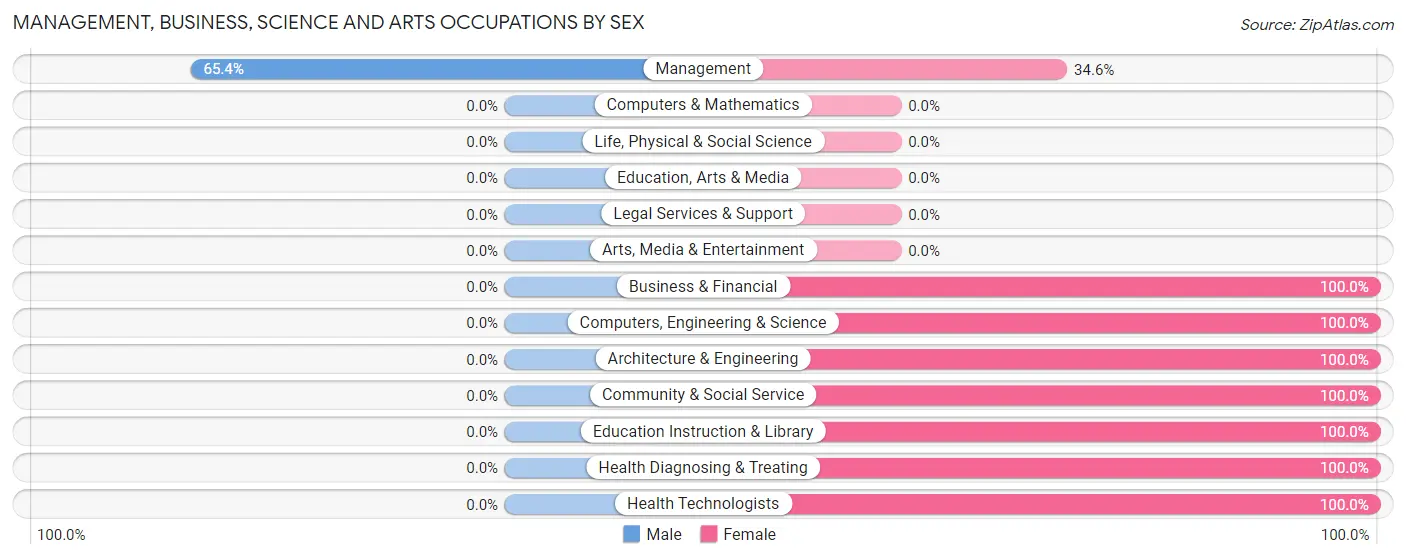
Management, Business, Science and Arts Occupations by Sex
| Occupation | Male | Female |
| Management | 17 (65.4%) | 9 (34.6%) |
| Business & Financial | 0 (0.0%) | 25 (100.0%) |
| Computers, Engineering & Science | 0 (0.0%) | 7 (100.0%) |
| Computers & Mathematics | 0 (0.0%) | 0 (0.0%) |
| Architecture & Engineering | 0 (0.0%) | 7 (100.0%) |
| Life, Physical & Social Science | 0 (0.0%) | 0 (0.0%) |
| Community & Social Service | 0 (0.0%) | 10 (100.0%) |
| Education, Arts & Media | 0 (0.0%) | 0 (0.0%) |
| Legal Services & Support | 0 (0.0%) | 0 (0.0%) |
| Education Instruction & Library | 0 (0.0%) | 10 (100.0%) |
| Arts, Media & Entertainment | 0 (0.0%) | 0 (0.0%) |
| Health Diagnosing & Treating | 0 (0.0%) | 37 (100.0%) |
| Health Technologists | 0 (0.0%) | 37 (100.0%) |
| Total (Category) | 17 (16.2%) | 88 (83.8%) |
| Total (Overall) | 337 (41.0%) | 484 (59.0%) |
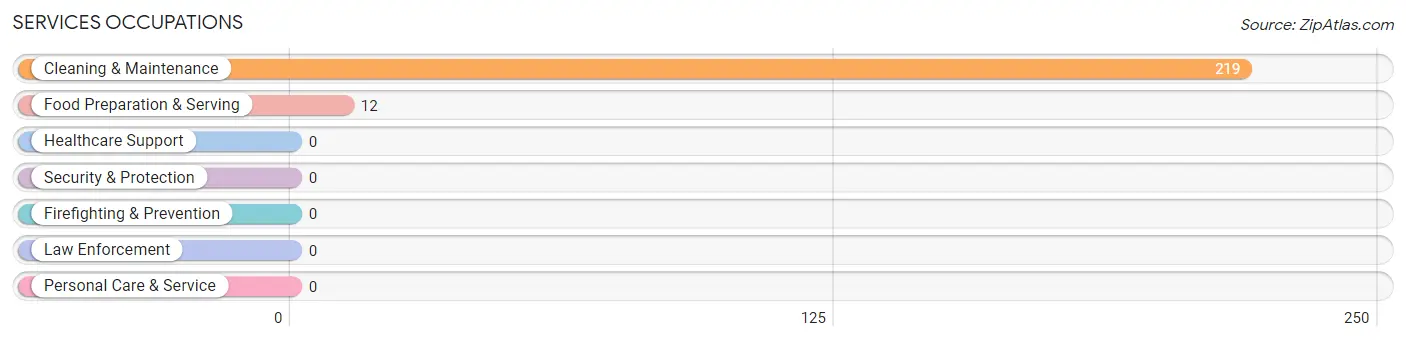
Services Occupations
The most common Services occupations in Lillian are Cleaning & Maintenance (219 | 26.7%), and Food Preparation & Serving (12 | 1.5%).
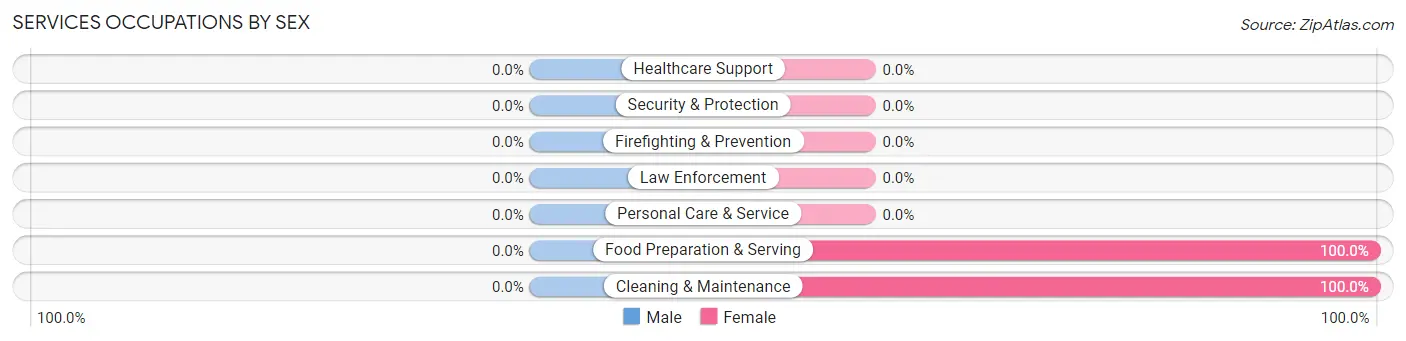
Services Occupations by Sex
| Occupation | Male | Female |
| Healthcare Support | 0 (0.0%) | 0 (0.0%) |
| Security & Protection | 0 (0.0%) | 0 (0.0%) |
| Firefighting & Prevention | 0 (0.0%) | 0 (0.0%) |
| Law Enforcement | 0 (0.0%) | 0 (0.0%) |
| Food Preparation & Serving | 0 (0.0%) | 12 (100.0%) |
| Cleaning & Maintenance | 0 (0.0%) | 219 (100.0%) |
| Personal Care & Service | 0 (0.0%) | 0 (0.0%) |
| Total (Category) | 0 (0.0%) | 231 (100.0%) |
| Total (Overall) | 337 (41.0%) | 484 (59.0%) |
Sales and Office Occupations
The most common Sales and Office occupations in Lillian are Sales & Related (164 | 20.0%), and Office & Administration (51 | 6.2%).
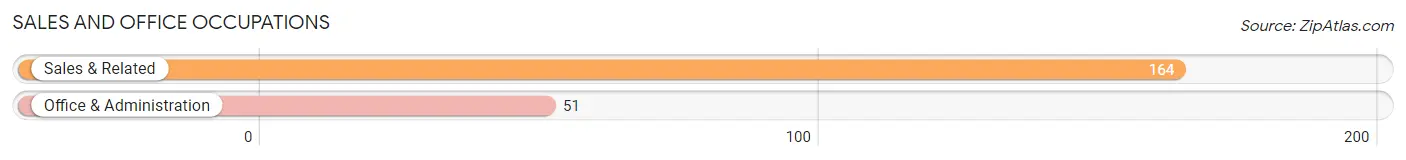
Sales and Office Occupations by Sex
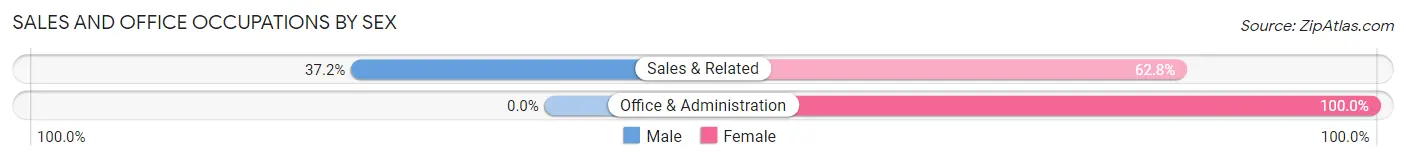
| Occupation | Male | Female |
| Sales & Related | 61 (37.2%) | 103 (62.8%) |
| Office & Administration | 0 (0.0%) | 51 (100.0%) |
| Total (Category) | 61 (28.4%) | 154 (71.6%) |
| Total (Overall) | 337 (41.0%) | 484 (59.0%) |
Natural Resources, Construction and Maintenance Occupations
The most common Natural Resources, Construction and Maintenance occupations in Lillian are Construction & Extraction (109 | 13.3%), and Installation, Maintenance & Repair (41 | 5.0%).
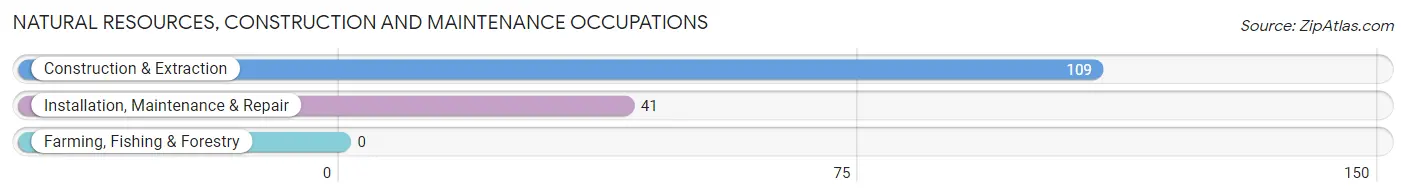
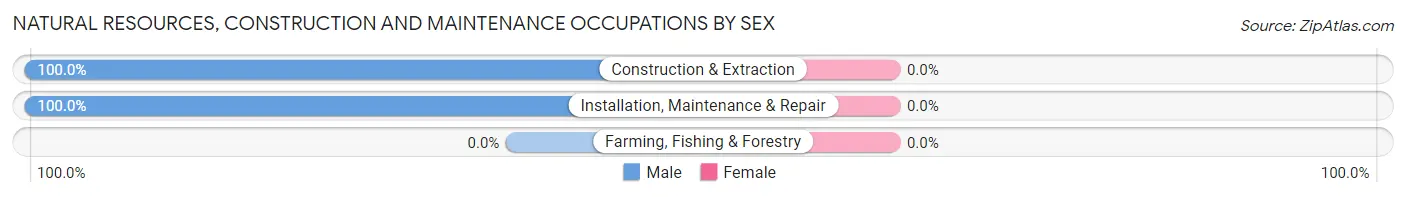
Natural Resources, Construction and Maintenance Occupations by Sex
| Occupation | Male | Female |
| Farming, Fishing & Forestry | 0 (0.0%) | 0 (0.0%) |
| Construction & Extraction | 109 (100.0%) | 0 (0.0%) |
| Installation, Maintenance & Repair | 41 (100.0%) | 0 (0.0%) |
| Total (Category) | 150 (100.0%) | 0 (0.0%) |
| Total (Overall) | 337 (41.0%) | 484 (59.0%) |
Production, Transportation and Moving Occupations
The most common Production, Transportation and Moving occupations in Lillian are Production (73 | 8.9%), Material Moving (27 | 3.3%), and Transportation (20 | 2.4%).
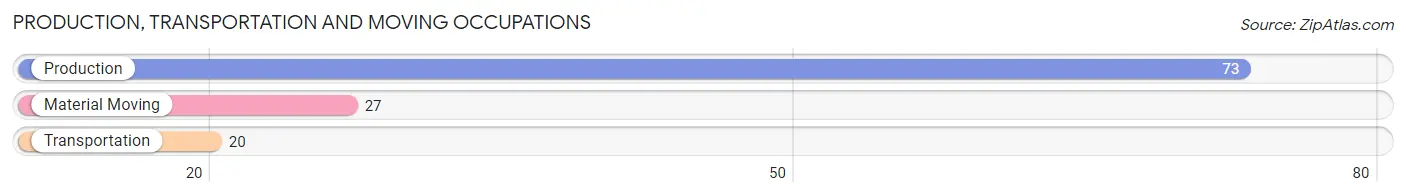
Production, Transportation and Moving Occupations by Sex
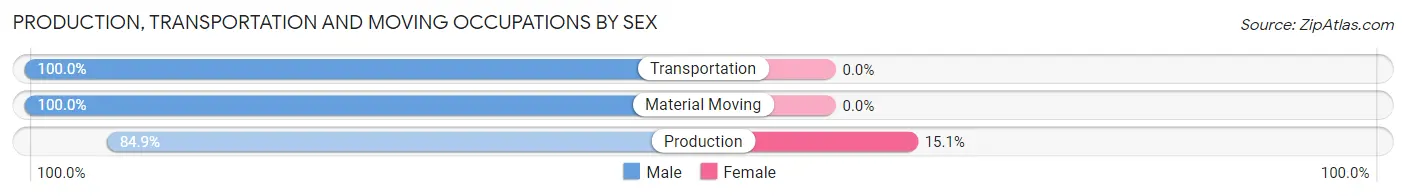
| Occupation | Male | Female |
| Production | 62 (84.9%) | 11 (15.1%) |
| Transportation | 20 (100.0%) | 0 (0.0%) |
| Material Moving | 27 (100.0%) | 0 (0.0%) |
| Total (Category) | 109 (90.8%) | 11 (9.2%) |
| Total (Overall) | 337 (41.0%) | 484 (59.0%) |
Employment Industries by Sex in Lillian
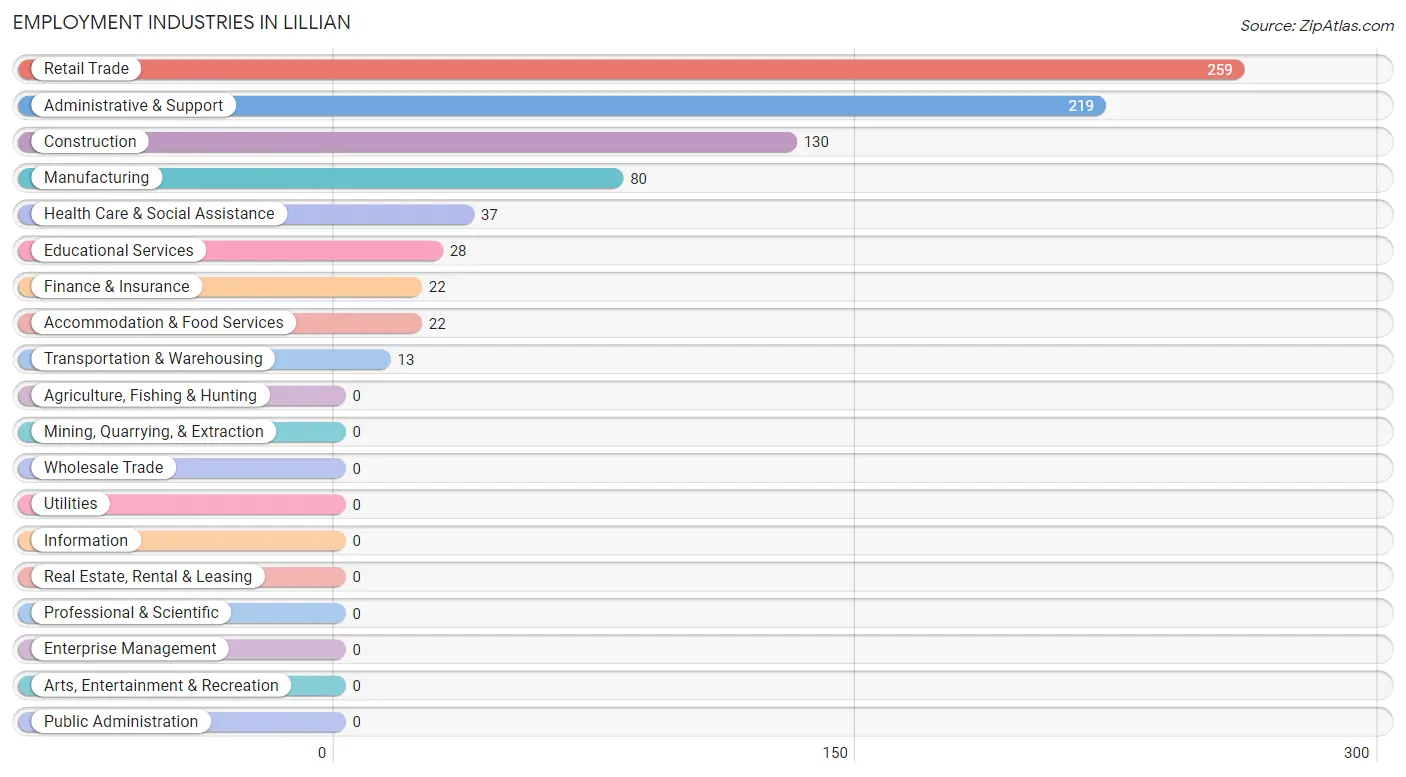
Employment Industries in Lillian
The major employment industries in Lillian include Retail Trade (259 | 31.6%), Administrative & Support (219 | 26.7%), Construction (130 | 15.8%), Manufacturing (80 | 9.7%), and Health Care & Social Assistance (37 | 4.5%).
Employment Industries by Sex in Lillian
The Lillian industries that see more men than women are Transportation & Warehousing (100.0%), Construction (89.2%), and Manufacturing (77.5%), whereas the industries that tend to have a higher number of women are Finance & Insurance (100.0%), Administrative & Support (100.0%), and Educational Services (100.0%).
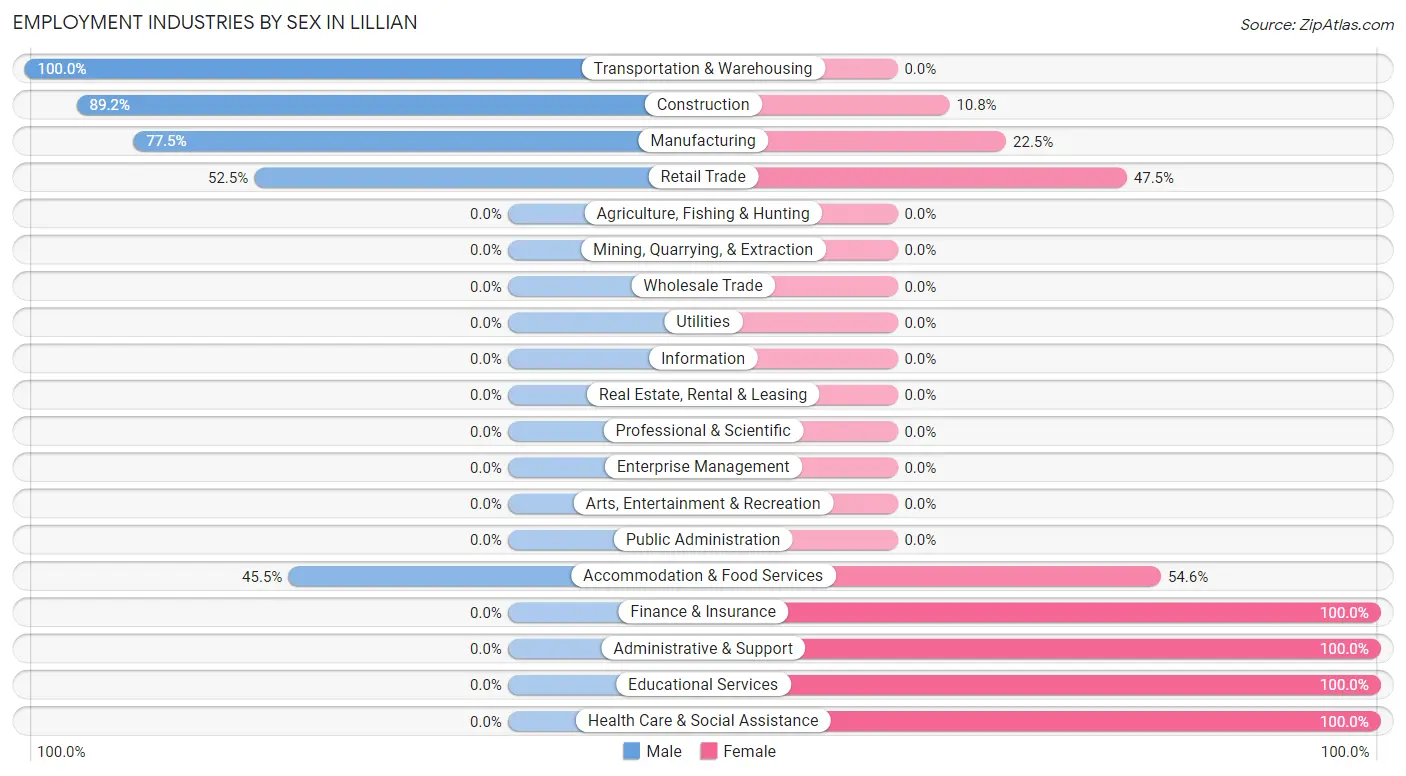
| Industry | Male | Female |
| Agriculture, Fishing & Hunting | 0 (0.0%) | 0 (0.0%) |
| Mining, Quarrying, & Extraction | 0 (0.0%) | 0 (0.0%) |
| Construction | 116 (89.2%) | 14 (10.8%) |
| Manufacturing | 62 (77.5%) | 18 (22.5%) |
| Wholesale Trade | 0 (0.0%) | 0 (0.0%) |
| Retail Trade | 136 (52.5%) | 123 (47.5%) |
| Transportation & Warehousing | 13 (100.0%) | 0 (0.0%) |
| Utilities | 0 (0.0%) | 0 (0.0%) |
| Information | 0 (0.0%) | 0 (0.0%) |
| Finance & Insurance | 0 (0.0%) | 22 (100.0%) |
| Real Estate, Rental & Leasing | 0 (0.0%) | 0 (0.0%) |
| Professional & Scientific | 0 (0.0%) | 0 (0.0%) |
| Enterprise Management | 0 (0.0%) | 0 (0.0%) |
| Administrative & Support | 0 (0.0%) | 219 (100.0%) |
| Educational Services | 0 (0.0%) | 28 (100.0%) |
| Health Care & Social Assistance | 0 (0.0%) | 37 (100.0%) |
| Arts, Entertainment & Recreation | 0 (0.0%) | 0 (0.0%) |
| Accommodation & Food Services | 10 (45.5%) | 12 (54.5%) |
| Public Administration | 0 (0.0%) | 0 (0.0%) |
| Total | 337 (41.0%) | 484 (59.0%) |
Education in Lillian
School Enrollment in Lillian
The most common levels of schooling among the 279 students in Lillian are middle school (104 | 37.3%), high school (85 | 30.5%), and graduate / professional (53 | 19.0%).

| School Level | # Students | % Students |
| Nursery / Preschool | 0 | 0.0% |
| Kindergarten | 0 | 0.0% |
| Elementary School | 37 | 13.3% |
| Middle School | 104 | 37.3% |
| High School | 85 | 30.5% |
| College / Undergraduate | 0 | 0.0% |
| Graduate / Professional | 53 | 19.0% |
| Total | 279 | 100.0% |
School Enrollment by Age by Funding Source in Lillian
Out of a total of 279 students who are enrolled in schools in Lillian, 87 (31.2%) attend a private institution, while the remaining 192 (68.8%) are enrolled in public schools. The age group of 35 years and over has the highest likelihood of being enrolled in private schools, with 10 (100.0% in the age bracket) enrolled. Conversely, the age group of 5 to 9 year old has the lowest likelihood of being enrolled in a private school, with 37 (100.0% in the age bracket) attending a public institution.
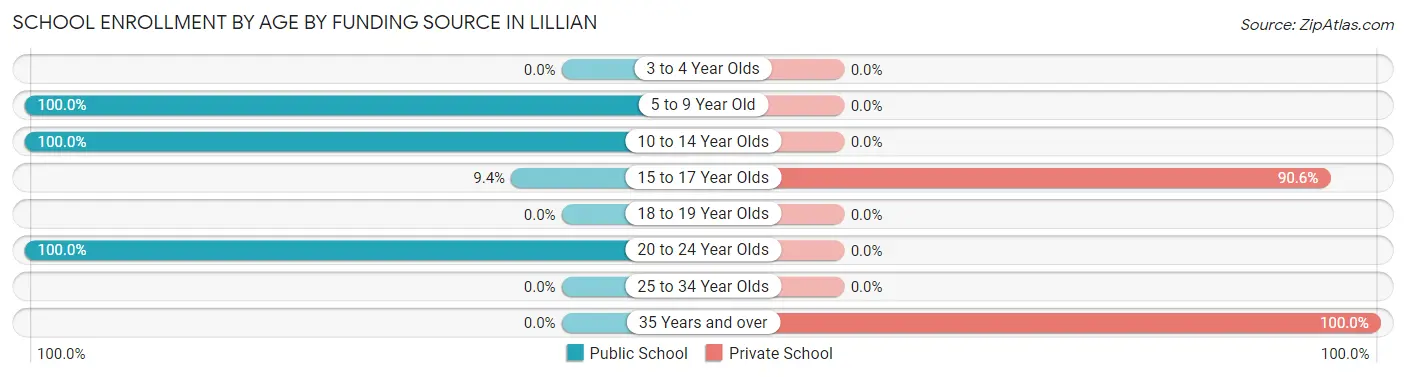
| Age Bracket | Public School | Private School |
| 3 to 4 Year Olds | 0 (0.0%) | 0 (0.0%) |
| 5 to 9 Year Old | 37 (100.0%) | 0 (0.0%) |
| 10 to 14 Year Olds | 104 (100.0%) | 0 (0.0%) |
| 15 to 17 Year Olds | 8 (9.4%) | 77 (90.6%) |
| 18 to 19 Year Olds | 0 (0.0%) | 0 (0.0%) |
| 20 to 24 Year Olds | 43 (100.0%) | 0 (0.0%) |
| 25 to 34 Year Olds | 0 (0.0%) | 0 (0.0%) |
| 35 Years and over | 0 (0.0%) | 10 (100.0%) |
| Total | 192 (68.8%) | 87 (31.2%) |
Educational Attainment by Field of Study in Lillian
Business (204 | 54.5%), science & technology (62 | 16.6%), education (42 | 11.2%), psychology (24 | 6.4%), and arts & humanities (18 | 4.8%) are the most common fields of study among 374 individuals in Lillian who have obtained a bachelor's degree or higher.
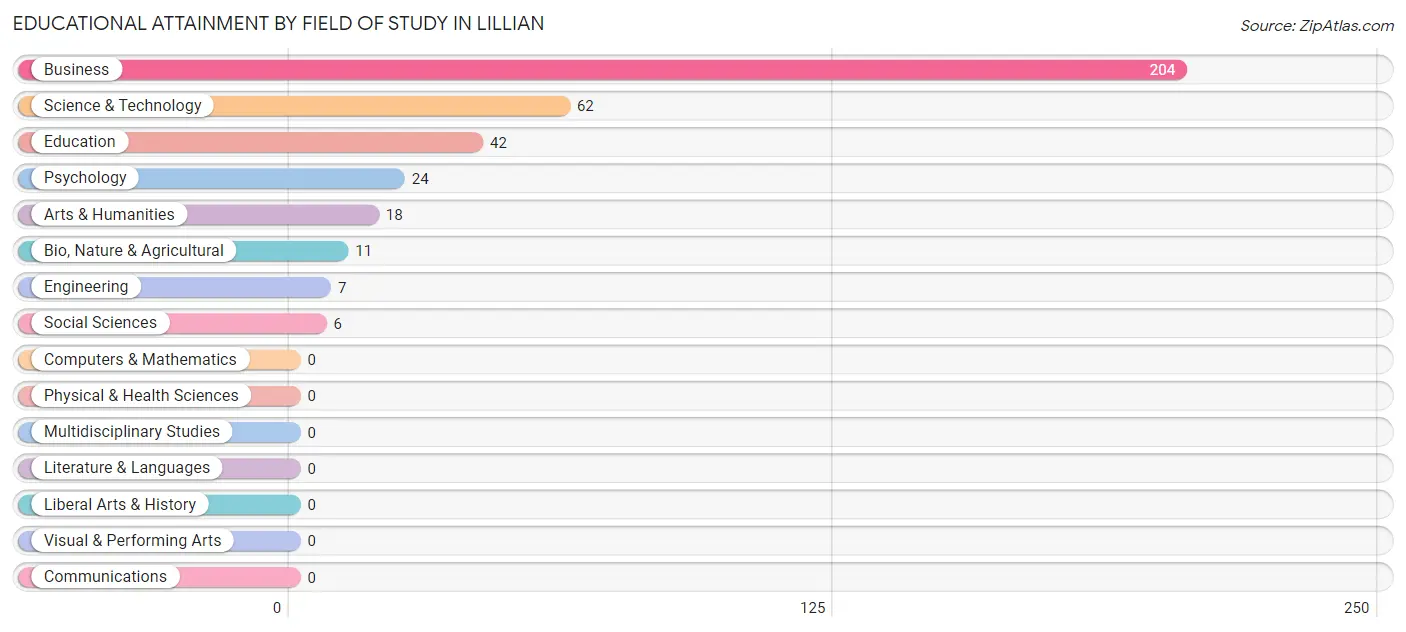
| Field of Study | # Graduates | % Graduates |
| Computers & Mathematics | 0 | 0.0% |
| Bio, Nature & Agricultural | 11 | 2.9% |
| Physical & Health Sciences | 0 | 0.0% |
| Psychology | 24 | 6.4% |
| Social Sciences | 6 | 1.6% |
| Engineering | 7 | 1.9% |
| Multidisciplinary Studies | 0 | 0.0% |
| Science & Technology | 62 | 16.6% |
| Business | 204 | 54.5% |
| Education | 42 | 11.2% |
| Literature & Languages | 0 | 0.0% |
| Liberal Arts & History | 0 | 0.0% |
| Visual & Performing Arts | 0 | 0.0% |
| Communications | 0 | 0.0% |
| Arts & Humanities | 18 | 4.8% |
| Total | 374 | 100.0% |
Transportation & Commute in Lillian
Vehicle Availability by Sex in Lillian
The most prevalent vehicle ownership categories in Lillian are males with 3 vehicles (116, accounting for 34.4%) and females with 3 vehicles (108, making up 25.1%).
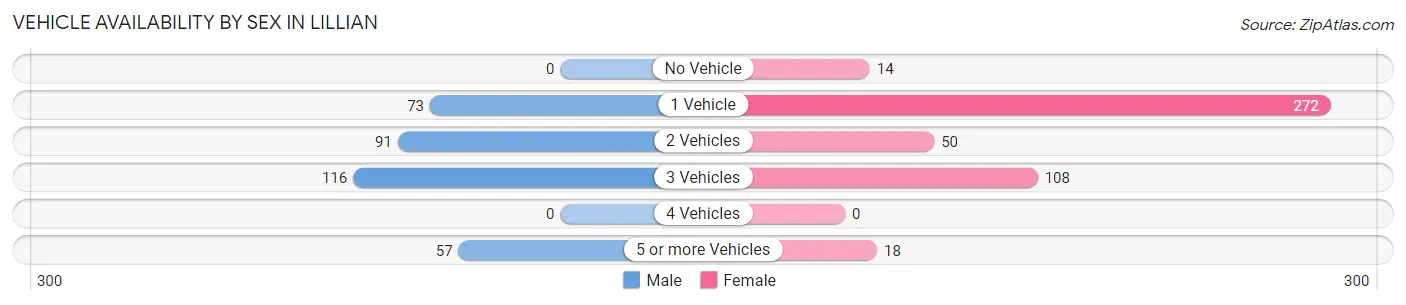
| Vehicles Available | Male | Female |
| No Vehicle | 0 (0.0%) | 14 (3.0%) |
| 1 Vehicle | 73 (21.7%) | 272 (58.9%) |
| 2 Vehicles | 91 (27.0%) | 50 (10.8%) |
| 3 Vehicles | 116 (34.4%) | 108 (23.4%) |
| 4 Vehicles | 0 (0.0%) | 0 (0.0%) |
| 5 or more Vehicles | 57 (16.9%) | 18 (3.9%) |
| Total | 337 (100.0%) | 462 (100.0%) |
Commute Time in Lillian
The most frequently occuring commute durations in Lillian are 10 to 14 minutes (239 commuters, 31.2%), 45 to 59 minutes (148 commuters, 19.3%), and 30 to 34 minutes (142 commuters, 18.5%).
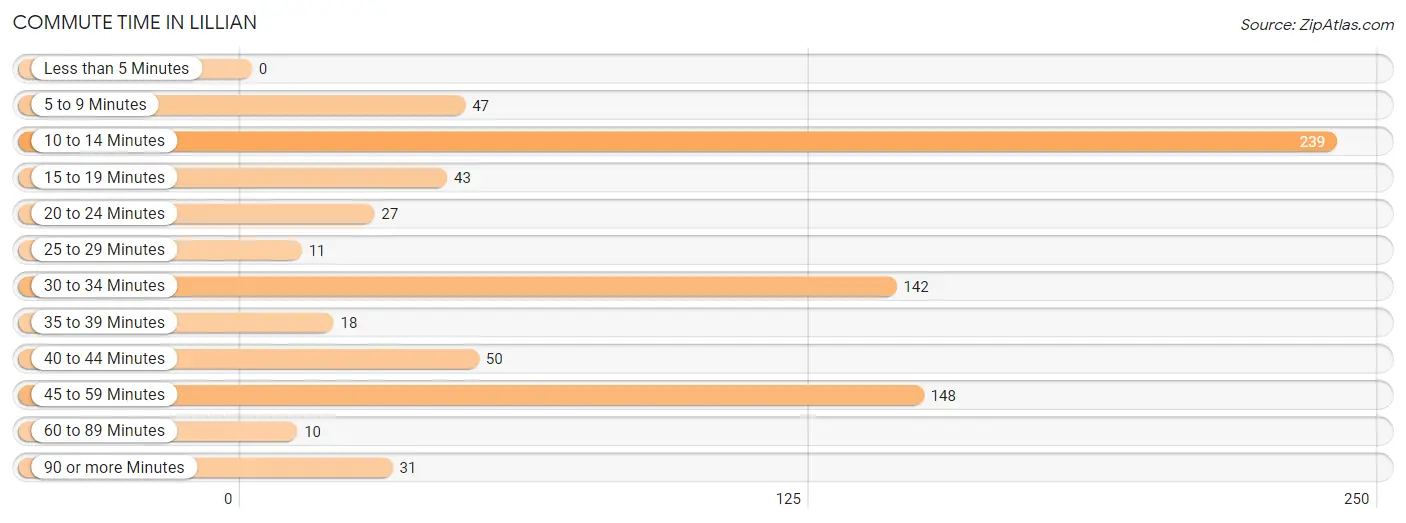
| Commute Time | # Commuters | % Commuters |
| Less than 5 Minutes | 0 | 0.0% |
| 5 to 9 Minutes | 47 | 6.1% |
| 10 to 14 Minutes | 239 | 31.2% |
| 15 to 19 Minutes | 43 | 5.6% |
| 20 to 24 Minutes | 27 | 3.5% |
| 25 to 29 Minutes | 11 | 1.4% |
| 30 to 34 Minutes | 142 | 18.5% |
| 35 to 39 Minutes | 18 | 2.4% |
| 40 to 44 Minutes | 50 | 6.5% |
| 45 to 59 Minutes | 148 | 19.3% |
| 60 to 89 Minutes | 10 | 1.3% |
| 90 or more Minutes | 31 | 4.1% |
Commute Time by Sex in Lillian
The most common commute times in Lillian are 45 to 59 minutes (119 commuters, 35.3%) for males and 10 to 14 minutes (219 commuters, 51.0%) for females.
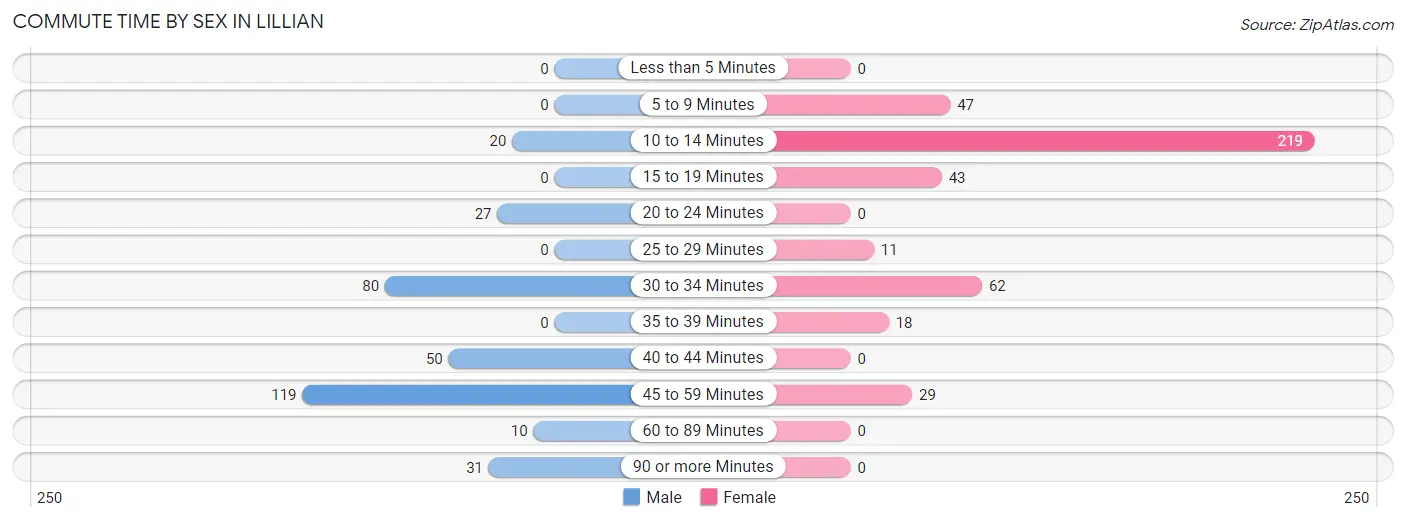
| Commute Time | Male | Female |
| Less than 5 Minutes | 0 (0.0%) | 0 (0.0%) |
| 5 to 9 Minutes | 0 (0.0%) | 47 (11.0%) |
| 10 to 14 Minutes | 20 (5.9%) | 219 (51.0%) |
| 15 to 19 Minutes | 0 (0.0%) | 43 (10.0%) |
| 20 to 24 Minutes | 27 (8.0%) | 0 (0.0%) |
| 25 to 29 Minutes | 0 (0.0%) | 11 (2.6%) |
| 30 to 34 Minutes | 80 (23.7%) | 62 (14.4%) |
| 35 to 39 Minutes | 0 (0.0%) | 18 (4.2%) |
| 40 to 44 Minutes | 50 (14.8%) | 0 (0.0%) |
| 45 to 59 Minutes | 119 (35.3%) | 29 (6.8%) |
| 60 to 89 Minutes | 10 (3.0%) | 0 (0.0%) |
| 90 or more Minutes | 31 (9.2%) | 0 (0.0%) |
Time of Departure to Work by Sex in Lillian
The most frequent times of departure to work in Lillian are 6:00 AM to 6:29 AM (116, 34.4%) for males and 9:00 AM to 9:59 AM (219, 51.0%) for females.
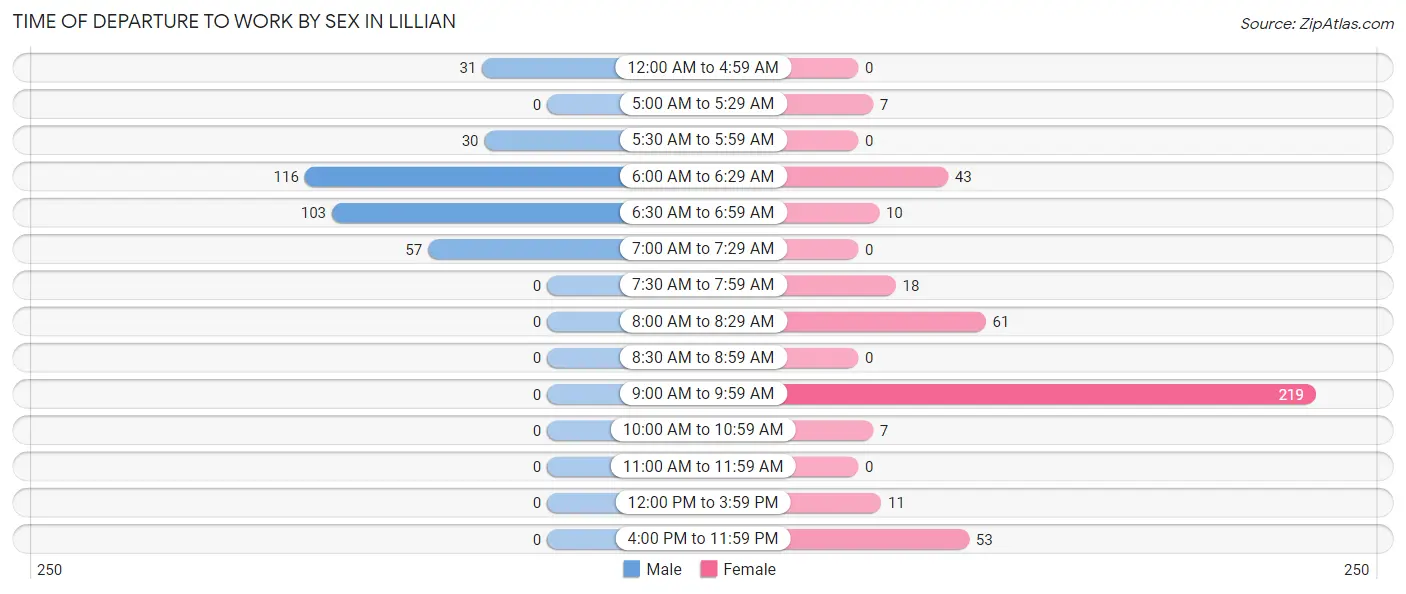
| Time of Departure | Male | Female |
| 12:00 AM to 4:59 AM | 31 (9.2%) | 0 (0.0%) |
| 5:00 AM to 5:29 AM | 0 (0.0%) | 7 (1.6%) |
| 5:30 AM to 5:59 AM | 30 (8.9%) | 0 (0.0%) |
| 6:00 AM to 6:29 AM | 116 (34.4%) | 43 (10.0%) |
| 6:30 AM to 6:59 AM | 103 (30.6%) | 10 (2.3%) |
| 7:00 AM to 7:29 AM | 57 (16.9%) | 0 (0.0%) |
| 7:30 AM to 7:59 AM | 0 (0.0%) | 18 (4.2%) |
| 8:00 AM to 8:29 AM | 0 (0.0%) | 61 (14.2%) |
| 8:30 AM to 8:59 AM | 0 (0.0%) | 0 (0.0%) |
| 9:00 AM to 9:59 AM | 0 (0.0%) | 219 (51.0%) |
| 10:00 AM to 10:59 AM | 0 (0.0%) | 7 (1.6%) |
| 11:00 AM to 11:59 AM | 0 (0.0%) | 0 (0.0%) |
| 12:00 PM to 3:59 PM | 0 (0.0%) | 11 (2.6%) |
| 4:00 PM to 11:59 PM | 0 (0.0%) | 53 (12.3%) |
| Total | 337 (100.0%) | 429 (100.0%) |
Housing Occupancy in Lillian
Occupancy by Ownership in Lillian
Of the total 650 dwellings in Lillian, owner-occupied units account for 530 (81.5%), while renter-occupied units make up 120 (18.5%).
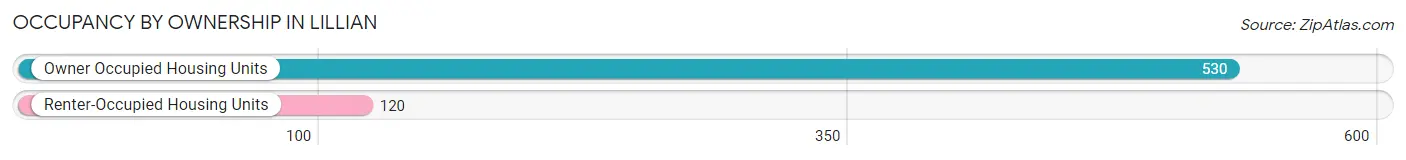
| Occupancy | # Housing Units | % Housing Units |
| Owner Occupied Housing Units | 530 | 81.5% |
| Renter-Occupied Housing Units | 120 | 18.5% |
| Total Occupied Housing Units | 650 | 100.0% |
Occupancy by Household Size in Lillian
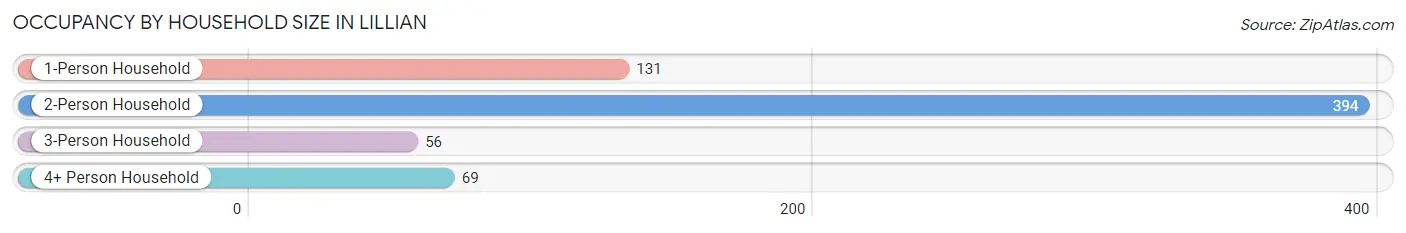
| Household Size | # Housing Units | % Housing Units |
| 1-Person Household | 131 | 20.2% |
| 2-Person Household | 394 | 60.6% |
| 3-Person Household | 56 | 8.6% |
| 4+ Person Household | 69 | 10.6% |
| Total Housing Units | 650 | 100.0% |
Occupancy by Ownership by Household Size in Lillian
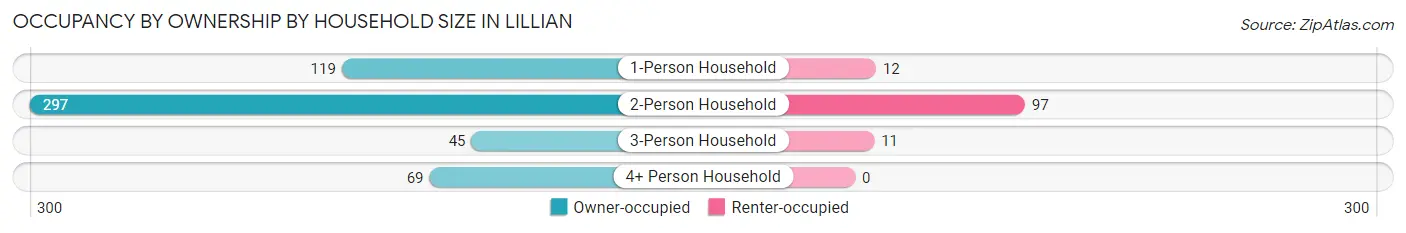
| Household Size | Owner-occupied | Renter-occupied |
| 1-Person Household | 119 (90.8%) | 12 (9.2%) |
| 2-Person Household | 297 (75.4%) | 97 (24.6%) |
| 3-Person Household | 45 (80.4%) | 11 (19.6%) |
| 4+ Person Household | 69 (100.0%) | 0 (0.0%) |
| Total Housing Units | 530 (81.5%) | 120 (18.5%) |
Occupancy by Educational Attainment in Lillian
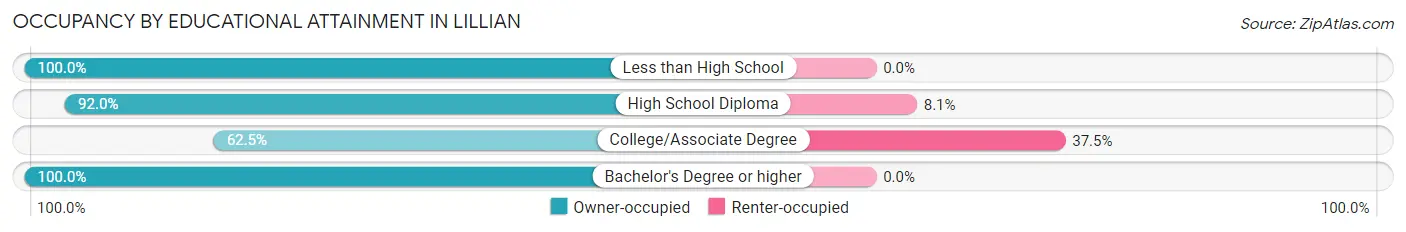
| Household Size | Owner-occupied | Renter-occupied |
| Less than High School | 31 (100.0%) | 0 (0.0%) |
| High School Diploma | 137 (91.9%) | 12 (8.1%) |
| College/Associate Degree | 180 (62.5%) | 108 (37.5%) |
| Bachelor's Degree or higher | 182 (100.0%) | 0 (0.0%) |
Occupancy by Age of Householder in Lillian
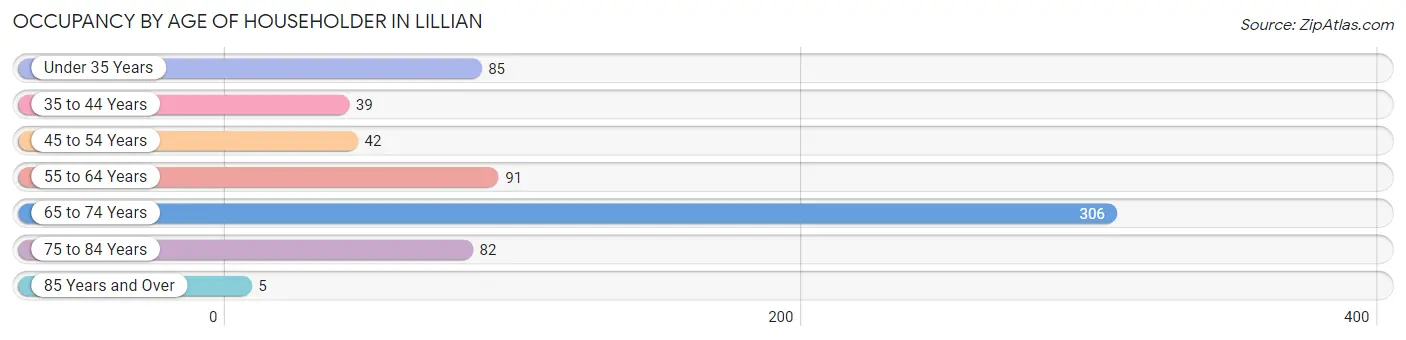
| Age Bracket | # Households | % Households |
| Under 35 Years | 85 | 13.1% |
| 35 to 44 Years | 39 | 6.0% |
| 45 to 54 Years | 42 | 6.5% |
| 55 to 64 Years | 91 | 14.0% |
| 65 to 74 Years | 306 | 47.1% |
| 75 to 84 Years | 82 | 12.6% |
| 85 Years and Over | 5 | 0.8% |
| Total | 650 | 100.0% |
Housing Finances in Lillian
Median Income by Occupancy in Lillian
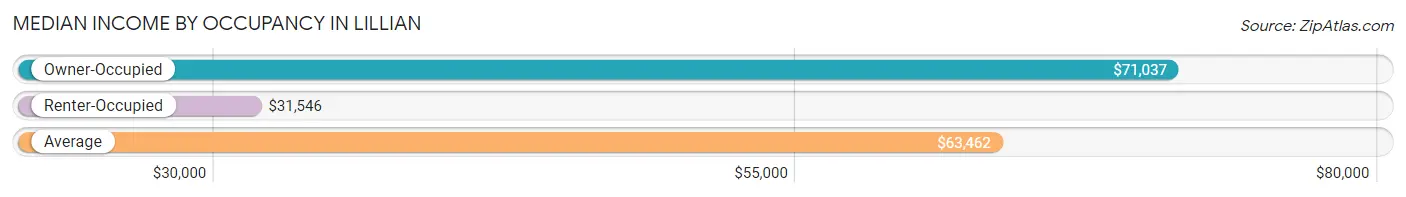
| Occupancy Type | # Households | Median Income |
| Owner-Occupied | 530 (81.5%) | $71,037 |
| Renter-Occupied | 120 (18.5%) | $31,546 |
| Average | 650 (100.0%) | $63,462 |
Occupancy by Householder Income Bracket in Lillian
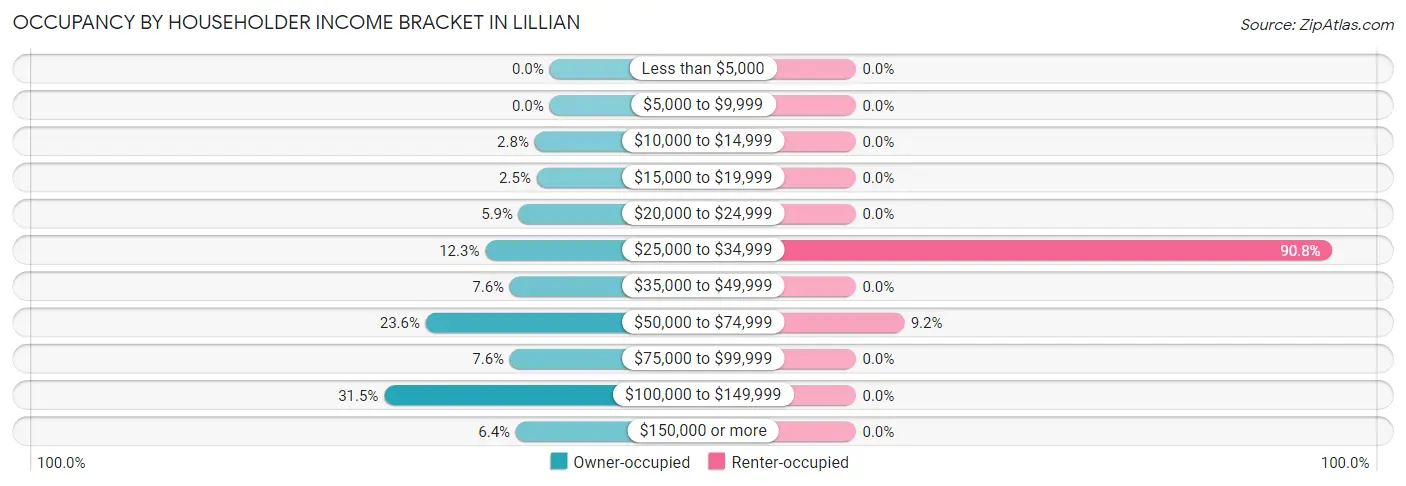
| Income Bracket | Owner-occupied | Renter-occupied |
| Less than $5,000 | 0 (0.0%) | 0 (0.0%) |
| $5,000 to $9,999 | 0 (0.0%) | 0 (0.0%) |
| $10,000 to $14,999 | 15 (2.8%) | 0 (0.0%) |
| $15,000 to $19,999 | 13 (2.5%) | 0 (0.0%) |
| $20,000 to $24,999 | 31 (5.9%) | 0 (0.0%) |
| $25,000 to $34,999 | 65 (12.3%) | 109 (90.8%) |
| $35,000 to $49,999 | 40 (7.5%) | 0 (0.0%) |
| $50,000 to $74,999 | 125 (23.6%) | 11 (9.2%) |
| $75,000 to $99,999 | 40 (7.5%) | 0 (0.0%) |
| $100,000 to $149,999 | 167 (31.5%) | 0 (0.0%) |
| $150,000 or more | 34 (6.4%) | 0 (0.0%) |
| Total | 530 (100.0%) | 120 (100.0%) |
Monthly Housing Cost Tiers in Lillian
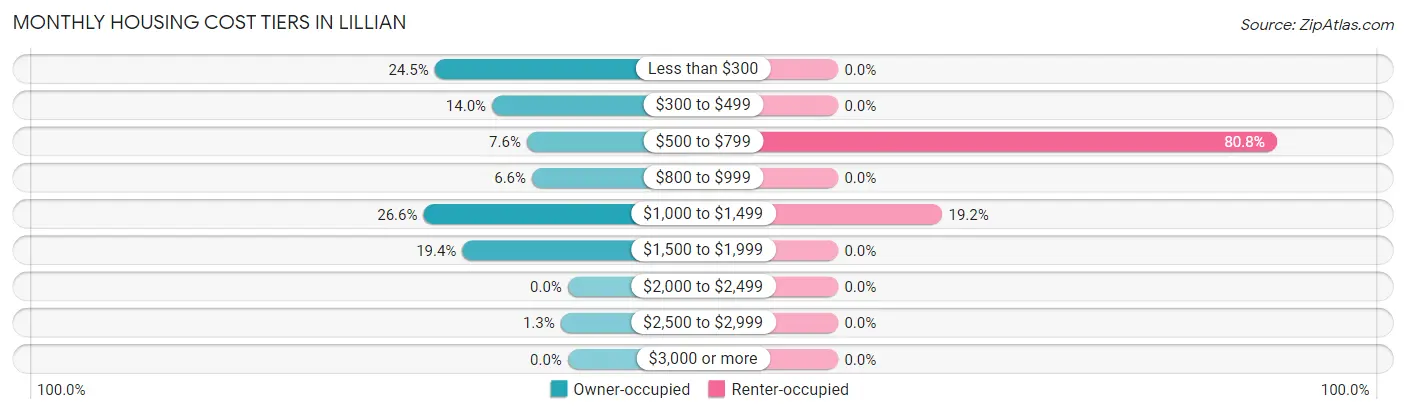
| Monthly Cost | Owner-occupied | Renter-occupied |
| Less than $300 | 130 (24.5%) | 0 (0.0%) |
| $300 to $499 | 74 (14.0%) | 0 (0.0%) |
| $500 to $799 | 40 (7.5%) | 97 (80.8%) |
| $800 to $999 | 35 (6.6%) | 0 (0.0%) |
| $1,000 to $1,499 | 141 (26.6%) | 23 (19.2%) |
| $1,500 to $1,999 | 103 (19.4%) | 0 (0.0%) |
| $2,000 to $2,499 | 0 (0.0%) | 0 (0.0%) |
| $2,500 to $2,999 | 7 (1.3%) | 0 (0.0%) |
| $3,000 or more | 0 (0.0%) | 0 (0.0%) |
| Total | 530 (100.0%) | 120 (100.0%) |
Physical Housing Characteristics in Lillian
Housing Structures in Lillian
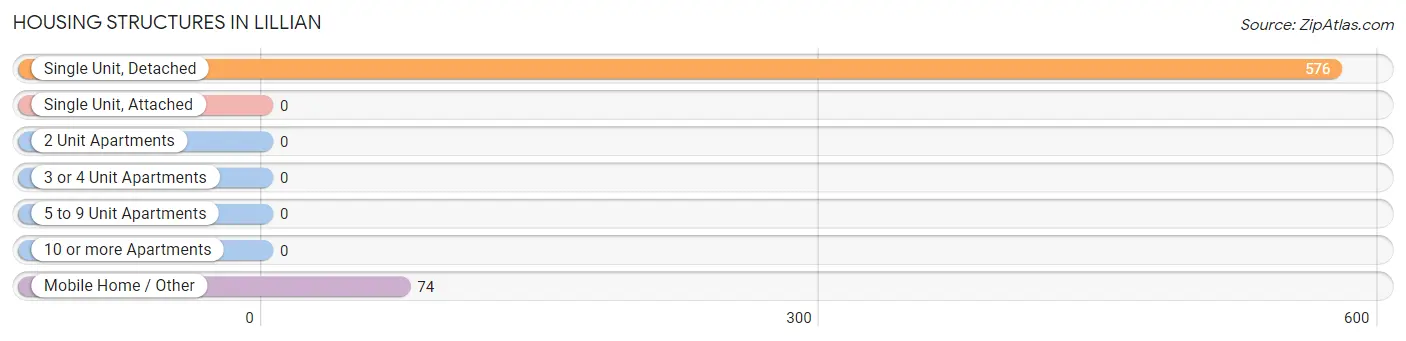
| Structure Type | # Housing Units | % Housing Units |
| Single Unit, Detached | 576 | 88.6% |
| Single Unit, Attached | 0 | 0.0% |
| 2 Unit Apartments | 0 | 0.0% |
| 3 or 4 Unit Apartments | 0 | 0.0% |
| 5 to 9 Unit Apartments | 0 | 0.0% |
| 10 or more Apartments | 0 | 0.0% |
| Mobile Home / Other | 74 | 11.4% |
| Total | 650 | 100.0% |
Housing Structures by Occupancy in Lillian
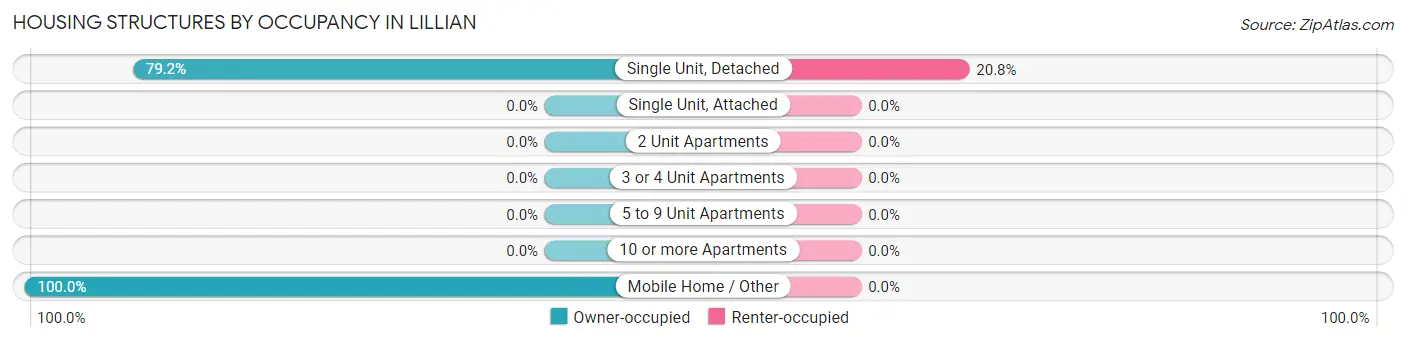
| Structure Type | Owner-occupied | Renter-occupied |
| Single Unit, Detached | 456 (79.2%) | 120 (20.8%) |
| Single Unit, Attached | 0 (0.0%) | 0 (0.0%) |
| 2 Unit Apartments | 0 (0.0%) | 0 (0.0%) |
| 3 or 4 Unit Apartments | 0 (0.0%) | 0 (0.0%) |
| 5 to 9 Unit Apartments | 0 (0.0%) | 0 (0.0%) |
| 10 or more Apartments | 0 (0.0%) | 0 (0.0%) |
| Mobile Home / Other | 74 (100.0%) | 0 (0.0%) |
| Total | 530 (81.5%) | 120 (18.5%) |
Housing Structures by Number of Rooms in Lillian
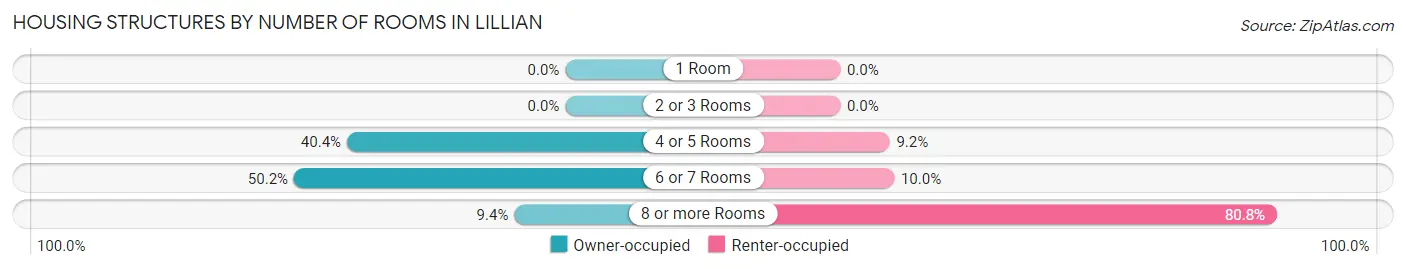
| Number of Rooms | Owner-occupied | Renter-occupied |
| 1 Room | 0 (0.0%) | 0 (0.0%) |
| 2 or 3 Rooms | 0 (0.0%) | 0 (0.0%) |
| 4 or 5 Rooms | 214 (40.4%) | 11 (9.2%) |
| 6 or 7 Rooms | 266 (50.2%) | 12 (10.0%) |
| 8 or more Rooms | 50 (9.4%) | 97 (80.8%) |
| Total | 530 (100.0%) | 120 (100.0%) |
Housing Structure by Heating Type in Lillian
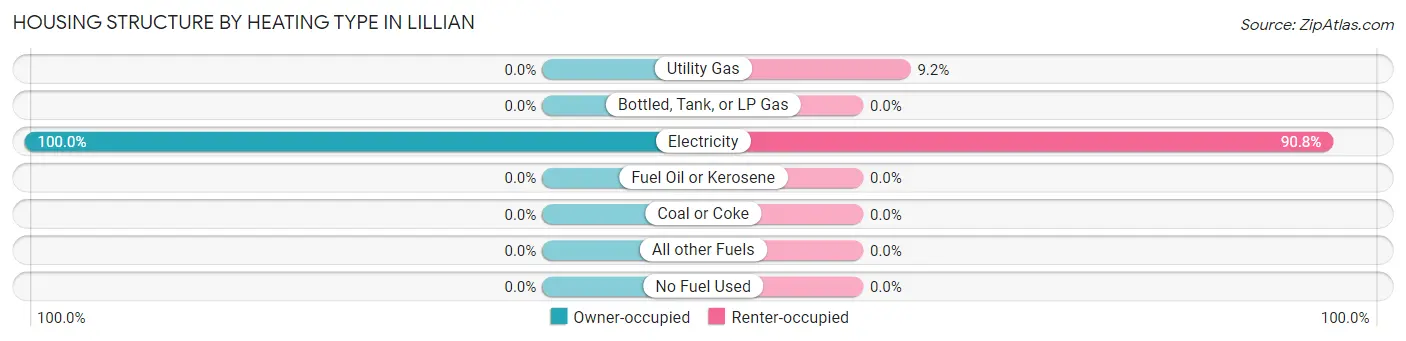
| Heating Type | Owner-occupied | Renter-occupied |
| Utility Gas | 0 (0.0%) | 11 (9.2%) |
| Bottled, Tank, or LP Gas | 0 (0.0%) | 0 (0.0%) |
| Electricity | 530 (100.0%) | 109 (90.8%) |
| Fuel Oil or Kerosene | 0 (0.0%) | 0 (0.0%) |
| Coal or Coke | 0 (0.0%) | 0 (0.0%) |
| All other Fuels | 0 (0.0%) | 0 (0.0%) |
| No Fuel Used | 0 (0.0%) | 0 (0.0%) |
| Total | 530 (100.0%) | 120 (100.0%) |
Household Vehicle Usage in Lillian
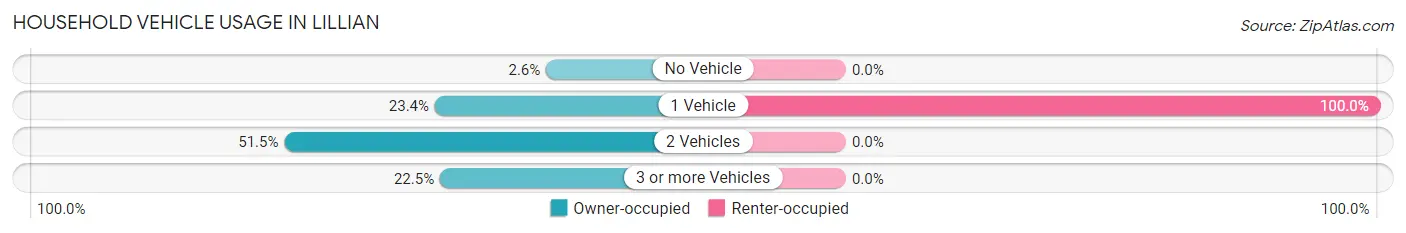
| Vehicles per Household | Owner-occupied | Renter-occupied |
| No Vehicle | 14 (2.6%) | 0 (0.0%) |
| 1 Vehicle | 124 (23.4%) | 120 (100.0%) |
| 2 Vehicles | 273 (51.5%) | 0 (0.0%) |
| 3 or more Vehicles | 119 (22.5%) | 0 (0.0%) |
| Total | 530 (100.0%) | 120 (100.0%) |
Real Estate & Mortgages in Lillian
Real Estate and Mortgage Overview in Lillian
| Characteristic | Without Mortgage | With Mortgage |
| Housing Units | 249 | 281 |
| Median Property Value | $177,100 | $245,800 |
| Median Household Income | $70,884 | $7 |
| Monthly Housing Costs | $269 | $0 |
| Real Estate Taxes | $380 | $29 |
Property Value by Mortgage Status in Lillian
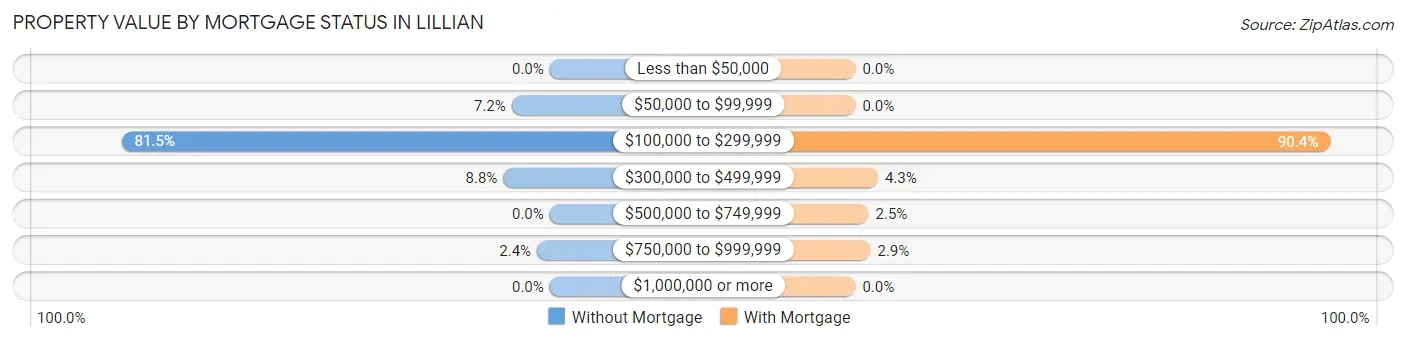
| Property Value | Without Mortgage | With Mortgage |
| Less than $50,000 | 0 (0.0%) | 0 (0.0%) |
| $50,000 to $99,999 | 18 (7.2%) | 0 (0.0%) |
| $100,000 to $299,999 | 203 (81.5%) | 254 (90.4%) |
| $300,000 to $499,999 | 22 (8.8%) | 12 (4.3%) |
| $500,000 to $749,999 | 0 (0.0%) | 7 (2.5%) |
| $750,000 to $999,999 | 6 (2.4%) | 8 (2.9%) |
| $1,000,000 or more | 0 (0.0%) | 0 (0.0%) |
| Total | 249 (100.0%) | 281 (100.0%) |
Household Income by Mortgage Status in Lillian
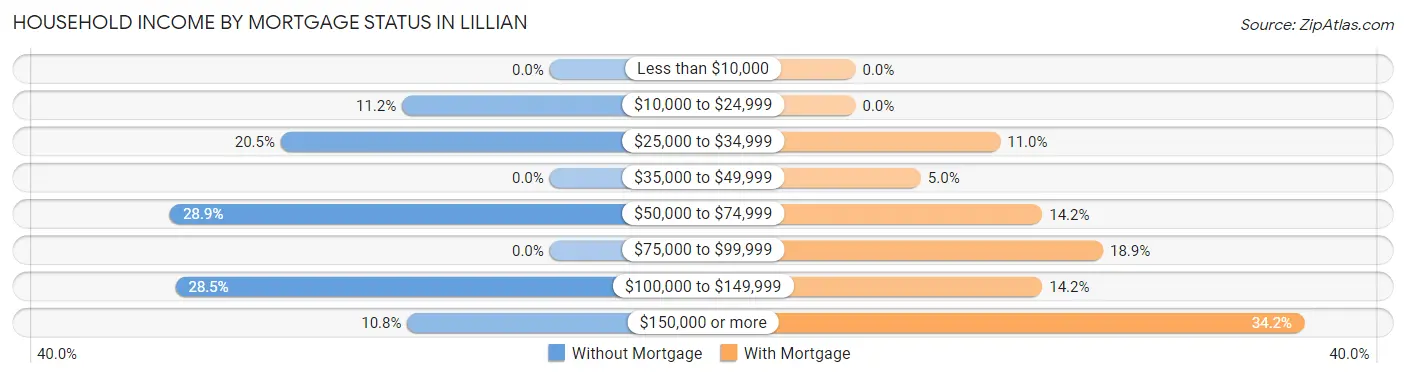
| Household Income | Without Mortgage | With Mortgage |
| Less than $10,000 | 0 (0.0%) | 0 (0.0%) |
| $10,000 to $24,999 | 28 (11.2%) | 0 (0.0%) |
| $25,000 to $34,999 | 51 (20.5%) | 31 (11.0%) |
| $35,000 to $49,999 | 0 (0.0%) | 14 (5.0%) |
| $50,000 to $74,999 | 72 (28.9%) | 40 (14.2%) |
| $75,000 to $99,999 | 0 (0.0%) | 53 (18.9%) |
| $100,000 to $149,999 | 71 (28.5%) | 40 (14.2%) |
| $150,000 or more | 27 (10.8%) | 96 (34.2%) |
| Total | 249 (100.0%) | 281 (100.0%) |
Property Value to Household Income Ratio in Lillian
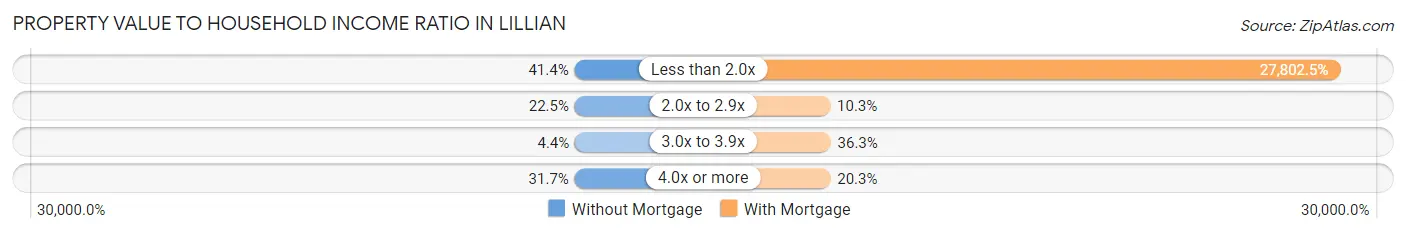
| Value-to-Income Ratio | Without Mortgage | With Mortgage |
| Less than 2.0x | 103 (41.4%) | 78,125 (27,802.5%) |
| 2.0x to 2.9x | 56 (22.5%) | 29 (10.3%) |
| 3.0x to 3.9x | 11 (4.4%) | 102 (36.3%) |
| 4.0x or more | 79 (31.7%) | 57 (20.3%) |
| Total | 249 (100.0%) | 281 (100.0%) |
Real Estate Taxes by Mortgage Status in Lillian
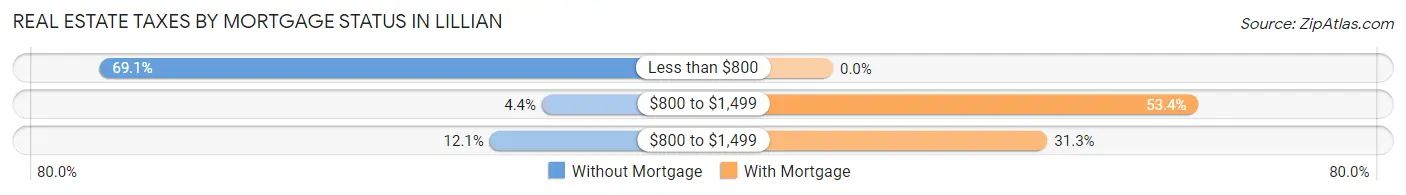
| Property Taxes | Without Mortgage | With Mortgage |
| Less than $800 | 172 (69.1%) | 0 (0.0%) |
| $800 to $1,499 | 11 (4.4%) | 150 (53.4%) |
| $800 to $1,499 | 30 (12.0%) | 88 (31.3%) |
| Total | 249 (100.0%) | 281 (100.0%) |
Health & Disability in Lillian
Health Insurance Coverage by Age in Lillian
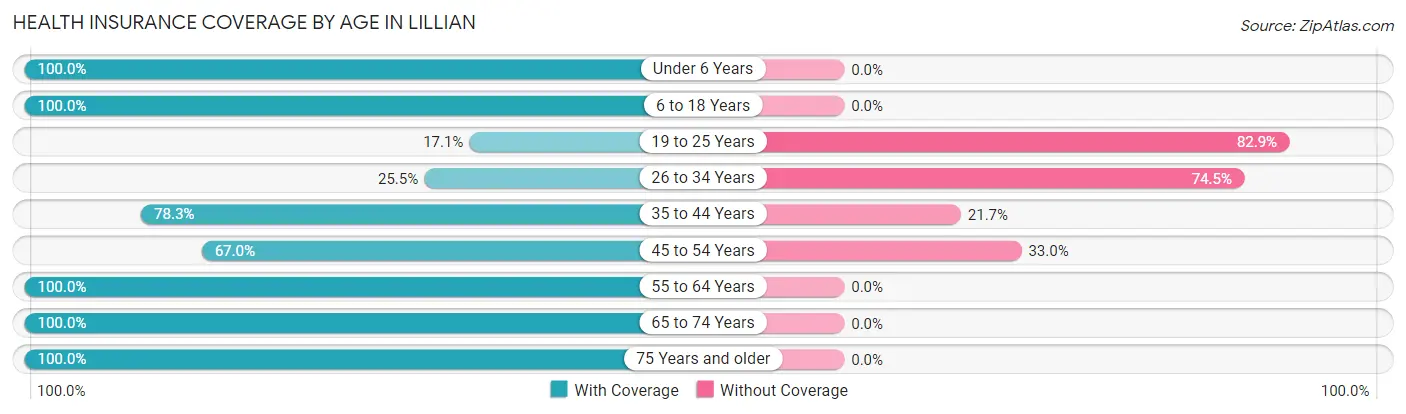
| Age Bracket | With Coverage | Without Coverage |
| Under 6 Years | 97 (100.0%) | 0 (0.0%) |
| 6 to 18 Years | 266 (100.0%) | 0 (0.0%) |
| 19 to 25 Years | 27 (17.1%) | 131 (82.9%) |
| 26 to 34 Years | 75 (25.5%) | 219 (74.5%) |
| 35 to 44 Years | 36 (78.3%) | 10 (21.7%) |
| 45 to 54 Years | 229 (67.0%) | 113 (33.0%) |
| 55 to 64 Years | 233 (100.0%) | 0 (0.0%) |
| 65 to 74 Years | 395 (100.0%) | 0 (0.0%) |
| 75 Years and older | 115 (100.0%) | 0 (0.0%) |
| Total | 1,473 (75.7%) | 473 (24.3%) |
Health Insurance Coverage by Citizenship Status in Lillian
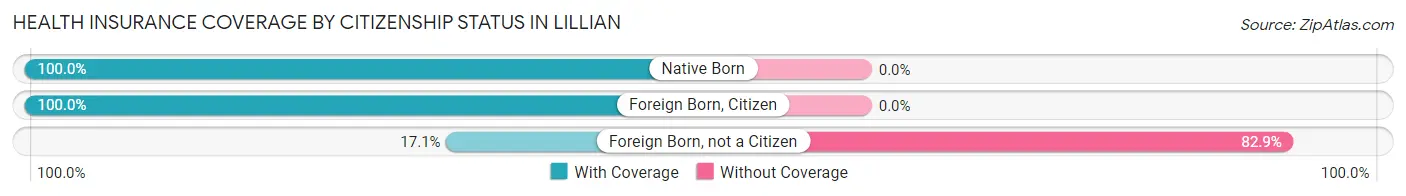
| Citizenship Status | With Coverage | Without Coverage |
| Native Born | 97 (100.0%) | 0 (0.0%) |
| Foreign Born, Citizen | 266 (100.0%) | 0 (0.0%) |
| Foreign Born, not a Citizen | 27 (17.1%) | 131 (82.9%) |
Health Insurance Coverage by Household Income in Lillian
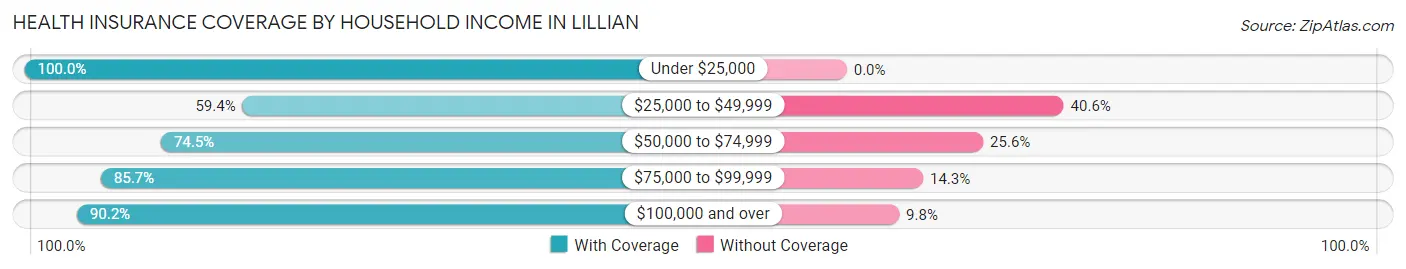
| Household Income | With Coverage | Without Coverage |
| Under $25,000 | 93 (100.0%) | 0 (0.0%) |
| $25,000 to $49,999 | 320 (59.4%) | 219 (40.6%) |
| $50,000 to $74,999 | 577 (74.5%) | 198 (25.6%) |
| $75,000 to $99,999 | 60 (85.7%) | 10 (14.3%) |
| $100,000 and over | 423 (90.2%) | 46 (9.8%) |
Public vs Private Health Insurance Coverage by Age in Lillian
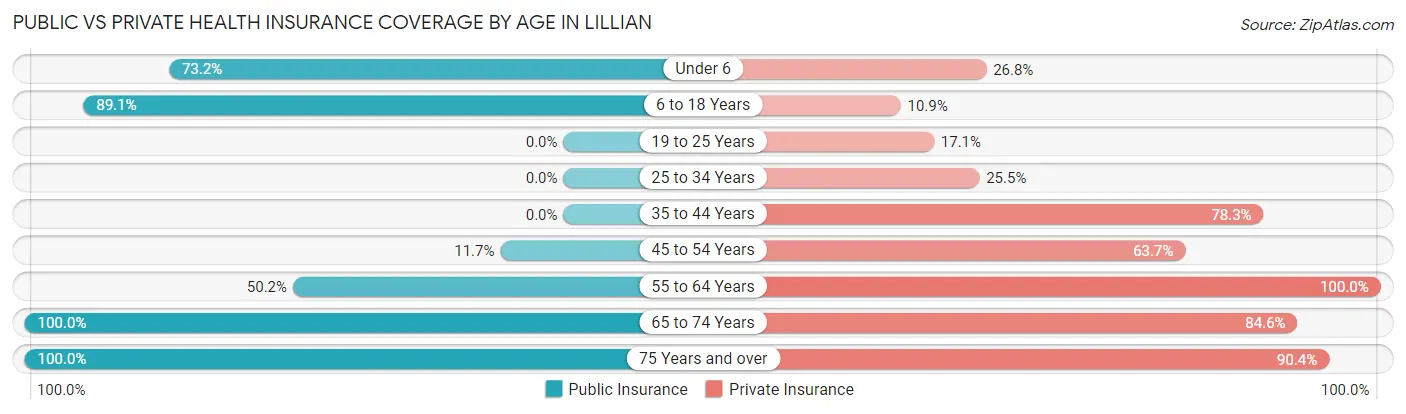
| Age Bracket | Public Insurance | Private Insurance |
| Under 6 | 71 (73.2%) | 26 (26.8%) |
| 6 to 18 Years | 237 (89.1%) | 29 (10.9%) |
| 19 to 25 Years | 0 (0.0%) | 27 (17.1%) |
| 25 to 34 Years | 0 (0.0%) | 75 (25.5%) |
| 35 to 44 Years | 0 (0.0%) | 36 (78.3%) |
| 45 to 54 Years | 40 (11.7%) | 218 (63.7%) |
| 55 to 64 Years | 117 (50.2%) | 233 (100.0%) |
| 65 to 74 Years | 395 (100.0%) | 334 (84.6%) |
| 75 Years and over | 115 (100.0%) | 104 (90.4%) |
| Total | 975 (50.1%) | 1,082 (55.6%) |
Disability Status by Sex by Age in Lillian
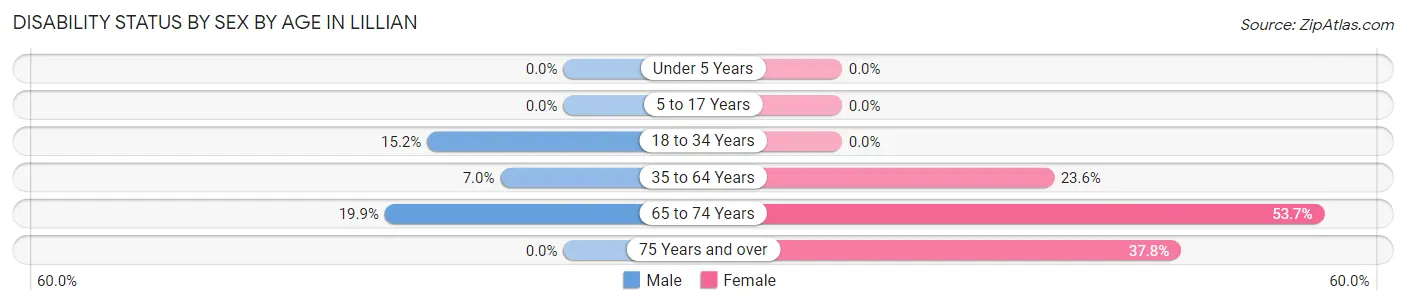
| Age Bracket | Male | Female |
| Under 5 Years | 0 (0.0%) | 0 (0.0%) |
| 5 to 17 Years | 0 (0.0%) | 0 (0.0%) |
| 18 to 34 Years | 27 (15.2%) | 0 (0.0%) |
| 35 to 64 Years | 21 (7.0%) | 76 (23.6%) |
| 65 to 74 Years | 36 (19.9%) | 115 (53.7%) |
| 75 Years and over | 0 (0.0%) | 17 (37.8%) |
Disability Class by Sex by Age in Lillian
Disability Class: Hearing Difficulty
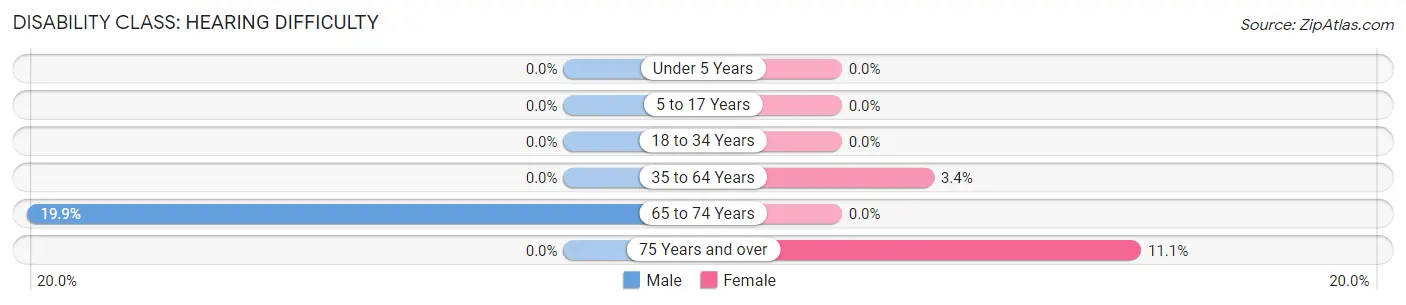
| Age Bracket | Male | Female |
| Under 5 Years | 0 (0.0%) | 0 (0.0%) |
| 5 to 17 Years | 0 (0.0%) | 0 (0.0%) |
| 18 to 34 Years | 0 (0.0%) | 0 (0.0%) |
| 35 to 64 Years | 0 (0.0%) | 11 (3.4%) |
| 65 to 74 Years | 36 (19.9%) | 0 (0.0%) |
| 75 Years and over | 0 (0.0%) | 5 (11.1%) |
Disability Class: Vision Difficulty
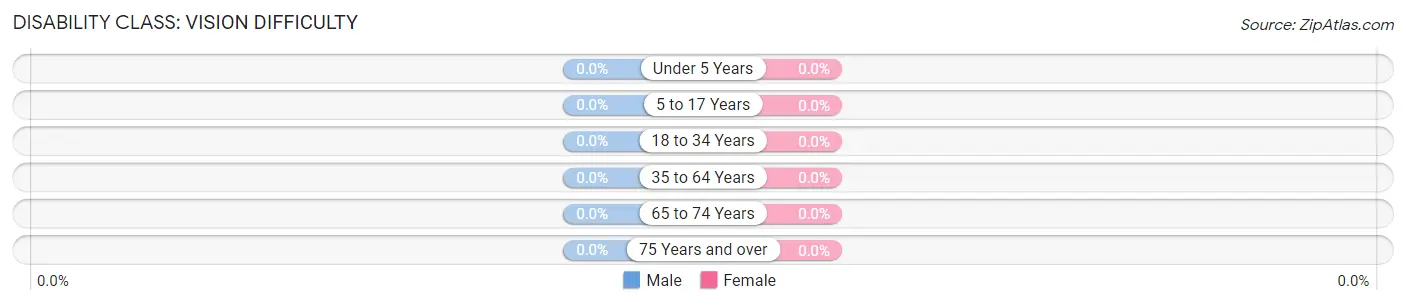
| Age Bracket | Male | Female |
| Under 5 Years | 0 (0.0%) | 0 (0.0%) |
| 5 to 17 Years | 0 (0.0%) | 0 (0.0%) |
| 18 to 34 Years | 0 (0.0%) | 0 (0.0%) |
| 35 to 64 Years | 0 (0.0%) | 0 (0.0%) |
| 65 to 74 Years | 0 (0.0%) | 0 (0.0%) |
| 75 Years and over | 0 (0.0%) | 0 (0.0%) |
Disability Class: Cognitive Difficulty
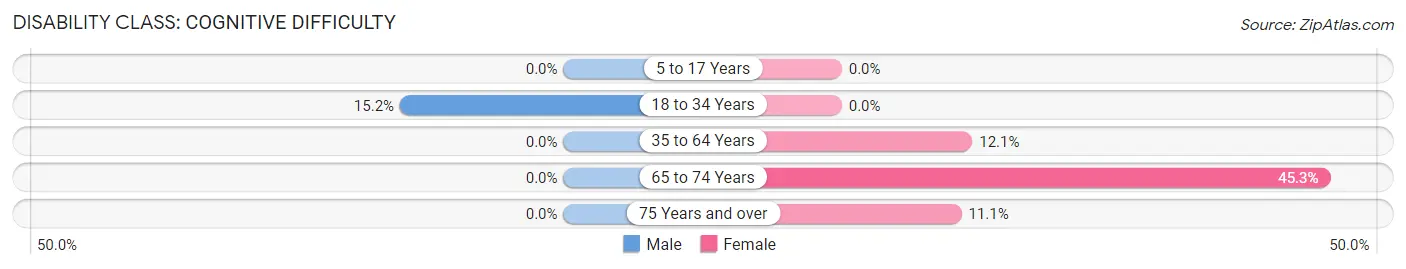
| Age Bracket | Male | Female |
| 5 to 17 Years | 0 (0.0%) | 0 (0.0%) |
| 18 to 34 Years | 27 (15.2%) | 0 (0.0%) |
| 35 to 64 Years | 0 (0.0%) | 39 (12.1%) |
| 65 to 74 Years | 0 (0.0%) | 97 (45.3%) |
| 75 Years and over | 0 (0.0%) | 5 (11.1%) |
Disability Class: Ambulatory Difficulty
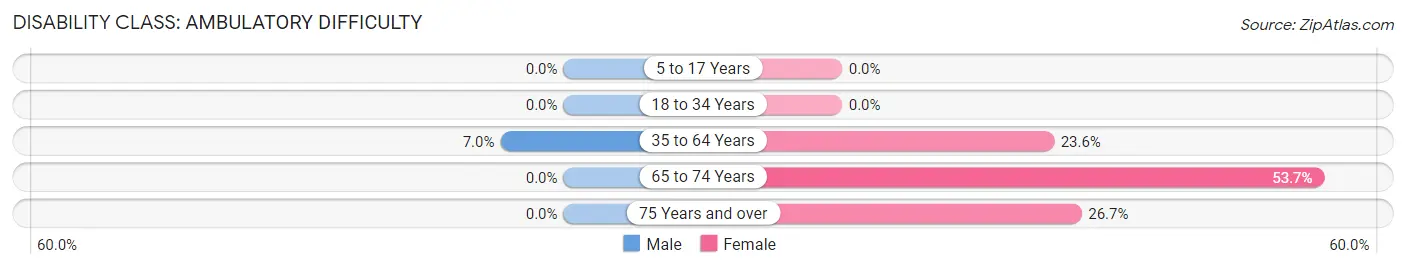
| Age Bracket | Male | Female |
| 5 to 17 Years | 0 (0.0%) | 0 (0.0%) |
| 18 to 34 Years | 0 (0.0%) | 0 (0.0%) |
| 35 to 64 Years | 21 (7.0%) | 76 (23.6%) |
| 65 to 74 Years | 0 (0.0%) | 115 (53.7%) |
| 75 Years and over | 0 (0.0%) | 12 (26.7%) |
Disability Class: Self-Care Difficulty
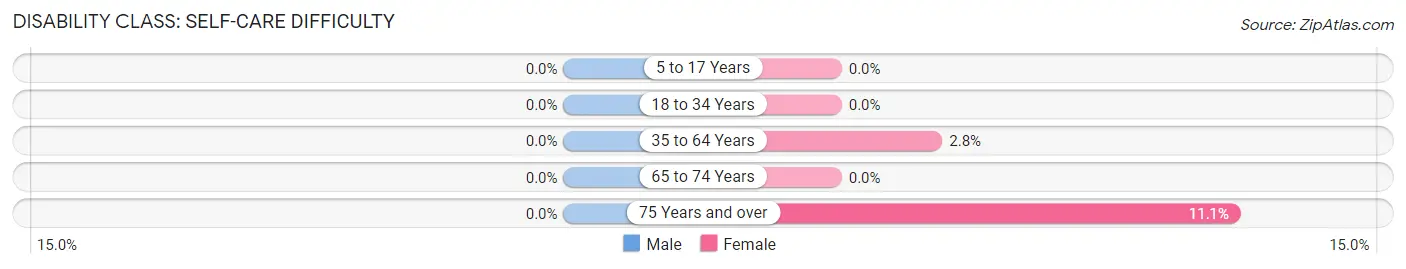
| Age Bracket | Male | Female |
| 5 to 17 Years | 0 (0.0%) | 0 (0.0%) |
| 18 to 34 Years | 0 (0.0%) | 0 (0.0%) |
| 35 to 64 Years | 0 (0.0%) | 9 (2.8%) |
| 65 to 74 Years | 0 (0.0%) | 0 (0.0%) |
| 75 Years and over | 0 (0.0%) | 5 (11.1%) |
Technology Access in Lillian
Computing Device Access in Lillian
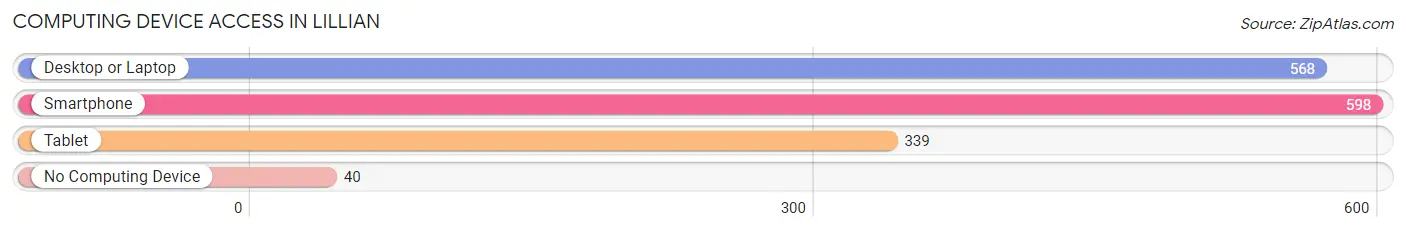
| Device Type | # Households | % Households |
| Desktop or Laptop | 568 | 87.4% |
| Smartphone | 598 | 92.0% |
| Tablet | 339 | 52.1% |
| No Computing Device | 40 | 6.1% |
| Total | 650 | 100.0% |
Internet Access in Lillian
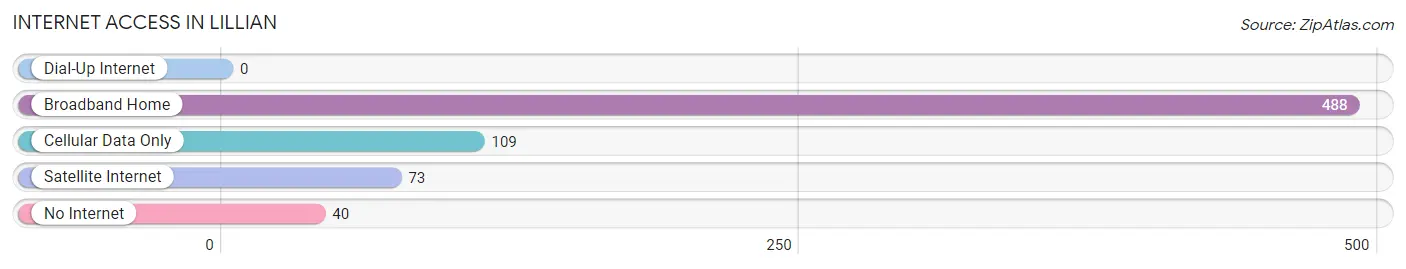
| Internet Type | # Households | % Households |
| Dial-Up Internet | 0 | 0.0% |
| Broadband Home | 488 | 75.1% |
| Cellular Data Only | 109 | 16.8% |
| Satellite Internet | 73 | 11.2% |
| No Internet | 40 | 6.1% |
| Total | 650 | 100.0% |
Lillian Summary
Lillian, Alabama is a small town located in Baldwin County, Alabama. It is situated on the eastern shore of Perdido Bay, just south of the Florida state line. The town was founded in 1883 and has a population of approximately 1,500 people.
Geography
Lillian is located in the southeastern corner of Baldwin County, Alabama. It is situated on the eastern shore of Perdido Bay, just south of the Florida state line. The town is bordered by the cities of Elberta, Foley, and Perdido Beach. The town is located approximately 30 miles east of Mobile, Alabama and approximately 40 miles west of Pensacola, Florida. The town is situated on a peninsula, with the Perdido Bay to the south and the Intracoastal Waterway to the north.
The town is located in a humid subtropical climate zone, with hot, humid summers and mild winters. The average annual temperature is around 70 degrees Fahrenheit, with an average high of around 90 degrees in the summer and an average low of around 50 degrees in the winter. The average annual precipitation is around 60 inches, with most of the rain falling in the summer months.
Economy
The economy of Lillian is largely based on tourism and fishing. The town is home to several marinas, which provide access to the Intracoastal Waterway and the Gulf of Mexico. The town is also home to several restaurants, bars, and shops, which cater to tourists and locals alike.
The town is also home to several manufacturing and industrial businesses, including a paper mill, a boat manufacturing plant, and a seafood processing plant. The town is also home to several small businesses, including a grocery store, a hardware store, and a pharmacy.
Demographics
As of the 2010 census, the population of Lillian was 1,521. The racial makeup of the town was 97.3% White, 0.7% African American, 0.3% Native American, 0.2% Asian, 0.1% Pacific Islander, 0.3% from other races, and 1.2% from two or more races. Hispanic or Latino of any race were 1.2% of the population.
The median income for a household in the town was $37,500, and the median income for a family was $45,000. The per capita income for the town was $19,000. About 11.3% of families and 14.2% of the population were below the poverty line, including 18.2% of those under age 18 and 8.3% of those age 65 or over.
Conclusion
Lillian, Alabama is a small town located in Baldwin County, Alabama. It is situated on the eastern shore of Perdido Bay, just south of the Florida state line. The town was founded in 1883 and has a population of approximately 1,500 people. The economy of Lillian is largely based on tourism and fishing, and the town is home to several marinas, restaurants, bars, and shops. The town is also home to several manufacturing and industrial businesses, as well as several small businesses. The population of Lillian is 97.3% White, 0.7% African American, 0.3% Native American, 0.2% Asian, 0.1% Pacific Islander, 0.3% from other races, and 1.2% from two or more races. The median income for a household in the town was $37,500, and the median income for a family was $45,000. The per capita income for the town was $19,000.
Common Questions
What is the Total Population of Lillian?
Total Population of Lillian is 1,946.
What is the Total Male Population of Lillian?
Total Male Population of Lillian is 983.
What is the Total Female Population of Lillian?
Total Female Population of Lillian is 963.
What is the Ratio of Males per 100 Females in Lillian?
There are 102.08 Males per 100 Females in Lillian.
What is the Ratio of Females per 100 Males in Lillian?
There are 97.97 Females per 100 Males in Lillian.
What is the Median Population Age in Lillian?
Median Population Age in Lillian is 46.8 Years.
What is the Average Family Size in Lillian
Average Family Size in Lillian is 3.5 People.
What is the Average Household Size in Lillian
Average Household Size in Lillian is 3.0 People.
What is Per Capita Income in Lillian?
Per Capita income in Lillian is $26,838.
What is the Median Family Income in Lillian?
Median Family Income in Lillian is $64,495.
What is the Median Household income in Lillian?
Median Household Income in Lillian is $63,462.
What is Inequality or Gini Index in Lillian?
Inequality or Gini Index in Lillian is 0.37.
How Large is the Labor Force in Lillian?
There are 821 People in the Labor Forcein in Lillian.
What is the Percentage of People in the Labor Force in Lillian?
48.3% of People are in the Labor Force in Lillian.