Cities with the Highest Percentage of Population Employed in Professional & Scientific Services in Alabama
RELATED REPORTS & OPTIONS
Professional & Scientific Services
Alabama
Compare Cities
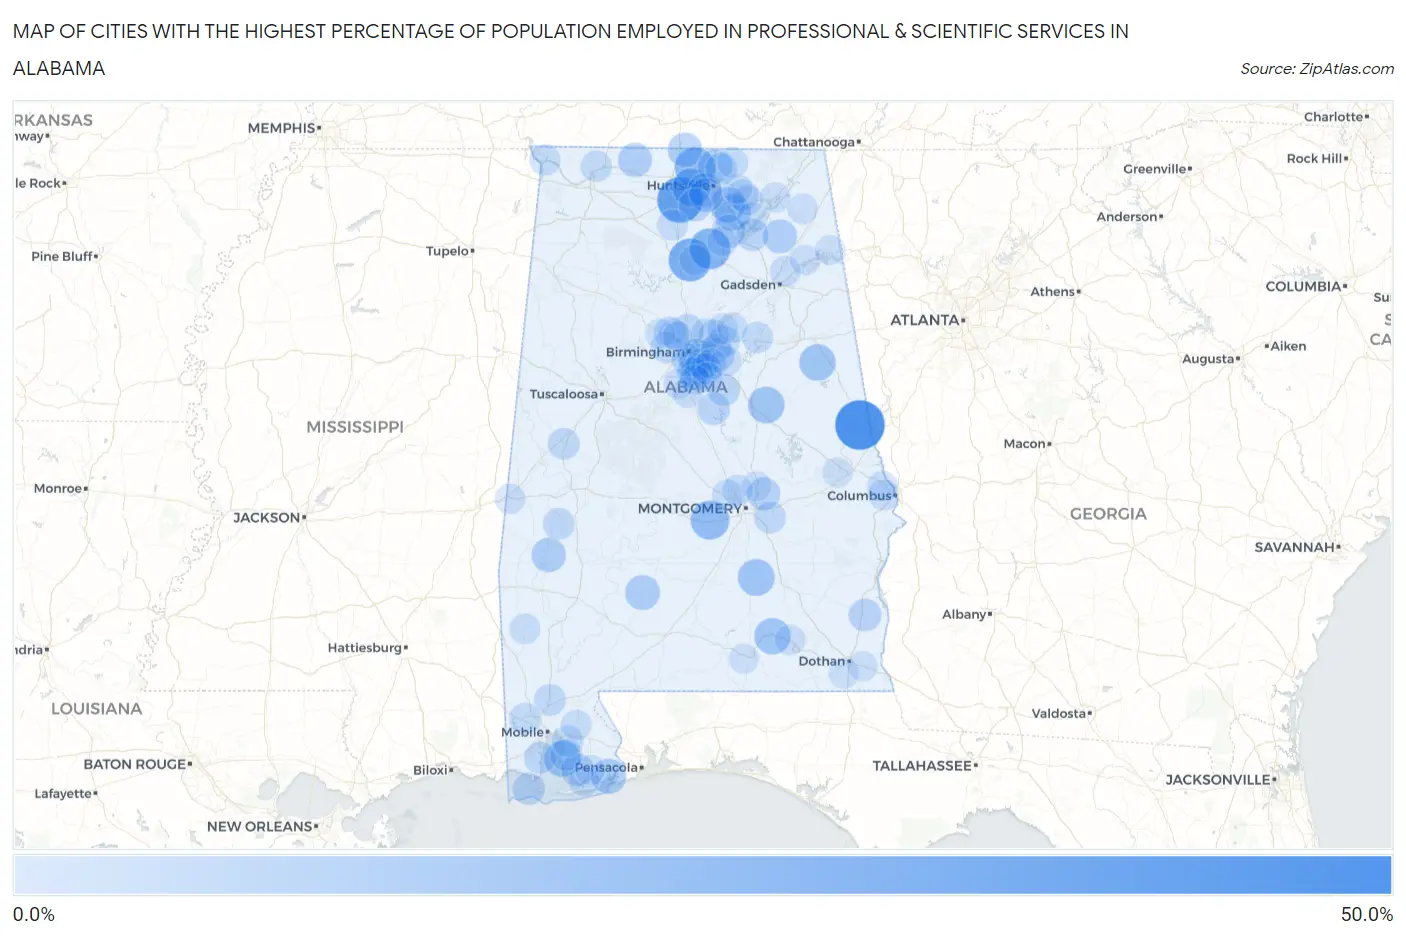
Map of Cities with the Highest Percentage of Population Employed in Professional & Scientific Services in Alabama
0.0%
50.0%
Cities with the Highest Percentage of Population Employed in Professional & Scientific Services in Alabama
| City | % Employed | vs State | vs National | |
| 1. | Fredonia | 45.8% | 5.8%(+40.0)#1 | 7.8%(+38.0)#94 |
| 2. | Mooresville | 37.1% | 5.8%(+31.3)#2 | 7.8%(+29.3)#159 |
| 3. | East Point | 31.5% | 5.8%(+25.7)#3 | 7.8%(+23.7)#248 |
| 4. | Baileyton | 27.9% | 5.8%(+22.1)#4 | 7.8%(+20.0)#343 |
| 5. | Harvest | 27.0% | 5.8%(+21.2)#5 | 7.8%(+19.2)#380 |
| 6. | Lowndesboro | 23.5% | 5.8%(+17.7)#6 | 7.8%(+15.7)#546 |
| 7. | Madison | 22.6% | 5.8%(+16.8)#7 | 7.8%(+14.8)#613 |
| 8. | Mountain Brook | 19.8% | 5.8%(+14.0)#8 | 7.8%(+12.0)#917 |
| 9. | Petrey | 19.4% | 5.8%(+13.5)#9 | 7.8%(+11.5)#966 |
| 10. | Hollins | 19.1% | 5.8%(+13.3)#10 | 7.8%(+11.3)#998 |
| 11. | Point Clear | 19.1% | 5.8%(+13.3)#11 | 7.8%(+11.3)#1,001 |
| 12. | New Hope | 19.0% | 5.8%(+13.1)#12 | 7.8%(+11.1)#1,029 |
| 13. | Elba | 18.7% | 5.8%(+12.9)#13 | 7.8%(+10.9)#1,061 |
| 14. | Delta | 18.6% | 5.8%(+12.8)#14 | 7.8%(+10.8)#1,067 |
| 15. | Owens Cross Roads | 16.9% | 5.8%(+11.1)#15 | 7.8%(+9.08)#1,385 |
| 16. | Perdido Beach | 16.0% | 5.8%(+10.2)#16 | 7.8%(+8.13)#1,609 |
| 17. | Beatrice | 15.8% | 5.8%(+9.97)#17 | 7.8%(+7.94)#1,653 |
| 18. | Ardmore | 14.8% | 5.8%(+8.99)#18 | 7.8%(+6.96)#1,927 |
| 19. | Putnam | 14.7% | 5.8%(+8.89)#19 | 7.8%(+6.86)#1,957 |
| 20. | Meridianville | 14.3% | 5.8%(+8.51)#20 | 7.8%(+6.48)#2,065 |
| 21. | Huntsville | 14.1% | 5.8%(+8.32)#21 | 7.8%(+6.29)#2,134 |
| 22. | Anderson | 14.1% | 5.8%(+8.31)#22 | 7.8%(+6.28)#2,136 |
| 23. | Redstone Arsenal | 14.1% | 5.8%(+8.29)#23 | 7.8%(+6.26)#2,142 |
| 24. | Geraldine | 13.9% | 5.8%(+8.11)#24 | 7.8%(+6.08)#2,197 |
| 25. | Dunnavant | 13.2% | 5.8%(+7.37)#25 | 7.8%(+5.34)#2,471 |
| 26. | Union Grove | 13.0% | 5.8%(+7.23)#26 | 7.8%(+5.20)#2,532 |
| 27. | Vestavia Hills | 13.0% | 5.8%(+7.22)#27 | 7.8%(+5.19)#2,534 |
| 28. | Homewood | 12.6% | 5.8%(+6.82)#28 | 7.8%(+4.79)#2,696 |
| 29. | Redland | 12.5% | 5.8%(+6.66)#29 | 7.8%(+4.63)#2,776 |
| 30. | Magnolia Springs | 11.6% | 5.8%(+5.73)#30 | 7.8%(+3.70)#3,227 |
| 31. | Triana | 11.5% | 5.8%(+5.70)#31 | 7.8%(+3.67)#3,249 |
| 32. | Abbeville | 11.5% | 5.8%(+5.68)#32 | 7.8%(+3.65)#3,259 |
| 33. | Shelby | 11.3% | 5.8%(+5.45)#33 | 7.8%(+3.43)#3,380 |
| 34. | Indian Springs Village | 10.9% | 5.8%(+5.12)#34 | 7.8%(+3.09)#3,556 |
| 35. | Guntersville | 10.8% | 5.8%(+5.01)#35 | 7.8%(+2.98)#3,635 |
| 36. | Dauphin Island | 10.8% | 5.8%(+5.01)#36 | 7.8%(+2.98)#3,638 |
| 37. | Brook Highland | 10.7% | 5.8%(+4.84)#37 | 7.8%(+2.81)#3,740 |
| 38. | Gardendale | 10.6% | 5.8%(+4.74)#38 | 7.8%(+2.71)#3,805 |
| 39. | Wilsonville | 10.5% | 5.8%(+4.64)#39 | 7.8%(+2.61)#3,873 |
| 40. | Belle Fontaine | 10.4% | 5.8%(+4.60)#40 | 7.8%(+2.57)#3,894 |
| 41. | Fairhope | 10.2% | 5.8%(+4.39)#41 | 7.8%(+2.36)#4,031 |
| 42. | Meadowbrook | 10.1% | 5.8%(+4.29)#42 | 7.8%(+2.26)#4,097 |
| 43. | Moody | 9.9% | 5.8%(+4.12)#43 | 7.8%(+2.09)#4,197 |
| 44. | Pike Road | 9.8% | 5.8%(+4.03)#44 | 7.8%(+2.00)#4,261 |
| 45. | Eutaw | 9.7% | 5.8%(+3.90)#45 | 7.8%(+1.87)#4,353 |
| 46. | Myrtlewood | 9.7% | 5.8%(+3.86)#46 | 7.8%(+1.83)#4,387 |
| 47. | Axis | 9.6% | 5.8%(+3.80)#47 | 7.8%(+1.77)#4,434 |
| 48. | Graysville | 9.4% | 5.8%(+3.59)#48 | 7.8%(+1.56)#4,604 |
| 49. | Paint Rock | 9.4% | 5.8%(+3.56)#49 | 7.8%(+1.53)#4,634 |
| 50. | Moores Mill | 9.4% | 5.8%(+3.54)#50 | 7.8%(+1.51)#4,653 |
| 51. | Semmes | 9.2% | 5.8%(+3.34)#51 | 7.8%(+1.31)#4,813 |
| 52. | St Florian | 9.0% | 5.8%(+3.21)#52 | 7.8%(+1.18)#4,942 |
| 53. | Daphne | 8.9% | 5.8%(+3.11)#53 | 7.8%(+1.08)#5,028 |
| 54. | Riverside | 8.8% | 5.8%(+2.96)#54 | 7.8%(+0.929)#5,177 |
| 55. | Maytown | 8.7% | 5.8%(+2.84)#55 | 7.8%(+0.806)#5,279 |
| 56. | Hoover | 8.6% | 5.8%(+2.82)#56 | 7.8%(+0.793)#5,286 |
| 57. | Eagle Point | 8.6% | 5.8%(+2.82)#57 | 7.8%(+0.792)#5,290 |
| 58. | Hartselle | 8.6% | 5.8%(+2.76)#58 | 7.8%(+0.732)#5,341 |
| 59. | Grayson Valley | 8.5% | 5.8%(+2.70)#59 | 7.8%(+0.672)#5,391 |
| 60. | Highland Lakes | 8.4% | 5.8%(+2.58)#60 | 7.8%(+0.545)#5,508 |
| 61. | Prattville | 8.3% | 5.8%(+2.52)#61 | 7.8%(+0.491)#5,549 |
| 62. | New Market | 8.2% | 5.8%(+2.43)#62 | 7.8%(+0.402)#5,637 |
| 63. | Waterloo | 8.0% | 5.8%(+2.18)#63 | 7.8%(+0.152)#5,921 |
| 64. | Trussville | 8.0% | 5.8%(+2.15)#64 | 7.8%(+0.117)#5,953 |
| 65. | Ladonia | 7.9% | 5.8%(+2.10)#65 | 7.8%(+0.070)#5,999 |
| 66. | Chatom | 7.9% | 5.8%(+2.10)#66 | 7.8%(+0.069)#6,001 |
| 67. | Leeds | 7.9% | 5.8%(+2.04)#67 | 7.8%(+0.015)#6,062 |
| 68. | Stapleton | 7.7% | 5.8%(+1.90)#68 | 7.8%(-0.134)#6,220 |
| 69. | Smiths Station | 7.7% | 5.8%(+1.88)#69 | 7.8%(-0.152)#6,236 |
| 70. | Woodville | 7.7% | 5.8%(+1.85)#70 | 7.8%(-0.175)#6,277 |
| 71. | Lookout Mountain | 7.6% | 5.8%(+1.83)#71 | 7.8%(-0.199)#6,306 |
| 72. | Shoal Creek | 7.6% | 5.8%(+1.78)#72 | 7.8%(-0.253)#6,364 |
| 73. | Berlin | 7.5% | 5.8%(+1.66)#73 | 7.8%(-0.367)#6,480 |
| 74. | Millbrook | 7.4% | 5.8%(+1.62)#74 | 7.8%(-0.406)#6,531 |
| 75. | Alabaster | 7.4% | 5.8%(+1.59)#75 | 7.8%(-0.439)#6,558 |
| 76. | Bon Secour | 7.3% | 5.8%(+1.51)#76 | 7.8%(-0.525)#6,683 |
| 77. | New Brockton | 7.3% | 5.8%(+1.49)#77 | 7.8%(-0.540)#6,706 |
| 78. | Sylvania | 7.3% | 5.8%(+1.44)#78 | 7.8%(-0.594)#6,764 |
| 79. | Cuba | 7.2% | 5.8%(+1.43)#79 | 7.8%(-0.601)#6,771 |
| 80. | Scottsboro | 7.2% | 5.8%(+1.43)#80 | 7.8%(-0.604)#6,779 |
| 81. | Helena | 7.2% | 5.8%(+1.40)#81 | 7.8%(-0.627)#6,804 |
| 82. | Cardiff | 7.1% | 5.8%(+1.33)#82 | 7.8%(-0.705)#6,917 |
| 83. | Argo | 7.1% | 5.8%(+1.31)#83 | 7.8%(-0.719)#6,930 |
| 84. | Grant | 7.1% | 5.8%(+1.28)#84 | 7.8%(-0.747)#6,967 |
| 85. | Odenville | 7.1% | 5.8%(+1.27)#85 | 7.8%(-0.757)#6,982 |
| 86. | Sterrett | 7.0% | 5.8%(+1.22)#86 | 7.8%(-0.814)#7,048 |
| 87. | Pelham | 7.0% | 5.8%(+1.18)#87 | 7.8%(-0.849)#7,097 |
| 88. | Foley | 7.0% | 5.8%(+1.15)#88 | 7.8%(-0.877)#7,148 |
| 89. | Arab | 6.9% | 5.8%(+1.09)#89 | 7.8%(-0.939)#7,233 |
| 90. | Leesburg | 6.8% | 5.8%(+1.01)#90 | 7.8%(-1.02)#7,324 |
| 91. | Chelsea | 6.7% | 5.8%(+0.881)#91 | 7.8%(-1.15)#7,514 |
| 92. | West Jefferson | 6.7% | 5.8%(+0.849)#92 | 7.8%(-1.18)#7,563 |
| 93. | Brookside | 6.5% | 5.8%(+0.730)#93 | 7.8%(-1.30)#7,743 |
| 94. | Auburn | 6.5% | 5.8%(+0.688)#94 | 7.8%(-1.34)#7,798 |
| 95. | Gurley | 6.5% | 5.8%(+0.676)#95 | 7.8%(-1.35)#7,809 |
| 96. | Rehobeth | 6.5% | 5.8%(+0.657)#96 | 7.8%(-1.37)#7,841 |
| 97. | Avon | 6.5% | 5.8%(+0.650)#97 | 7.8%(-1.38)#7,853 |
| 98. | Gaylesville | 6.5% | 5.8%(+0.634)#98 | 7.8%(-1.40)#7,880 |
| 99. | Wetumpka | 6.4% | 5.8%(+0.595)#99 | 7.8%(-1.44)#7,925 |
| 100. | Horn Hill | 6.3% | 5.8%(+0.520)#100 | 7.8%(-1.51)#8,023 |
Common Questions
What are the Top 10 Cities with the Highest Percentage of Population Employed in Professional & Scientific Services in Alabama?
Top 10 Cities with the Highest Percentage of Population Employed in Professional & Scientific Services in Alabama are:
#1
45.8%
#2
37.1%
#3
31.5%
#4
27.9%
#5
27.0%
#6
23.5%
#7
22.6%
#8
19.8%
#9
19.4%
#10
19.1%
What city has the Highest Percentage of Population Employed in Professional & Scientific Services in Alabama?
Fredonia has the Highest Percentage of Population Employed in Professional & Scientific Services in Alabama with 45.8%.
What is the Percentage of Population Employed in Professional & Scientific Services in the State of Alabama?
Percentage of Population Employed in Professional & Scientific Services in Alabama is 5.8%.
What is the Percentage of Population Employed in Professional & Scientific Services in the United States?
Percentage of Population Employed in Professional & Scientific Services in the United States is 7.8%.